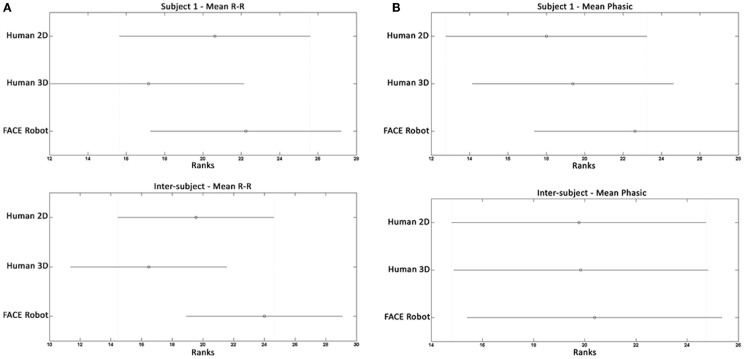
Figure 8.
Statistical analysis of two features extracted from HRV and SCR during the interpretation task based on human 2D photos, human 3D models, and the physical robot. (A) HRV results. Example of an intra-subject (subject 1) and an inter-subject statistical analysis result. The mean RR feature represents the mean value of the RR distance (ms). (B) SCR results. Example of an intra-subject (subject 1) and an inter-subject statistical analysis result. The mean-phasic feature represents the mean value of the SCR signal (uSiemens).

