
Figure 6.
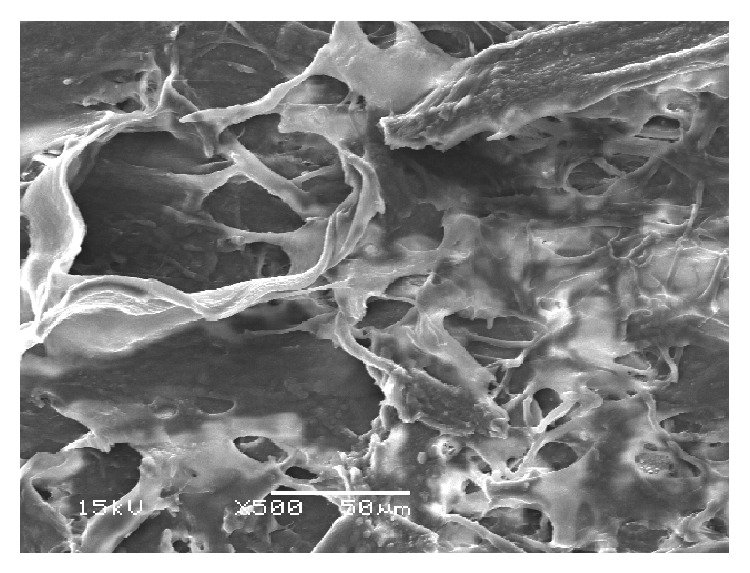
SEM of SLT-treated tissue (2.0 mJ). Note the destruction of trabecular beams with tissue scrolling at the edges of the treated areas.
Official websites use .gov
A
.gov website belongs to an official
government organization in the United States.
Secure .gov websites use HTTPS
A lock (
) or https:// means you've safely
connected to the .gov website. Share sensitive
information only on official, secure websites.
SEM of SLT-treated tissue (2.0 mJ). Note the destruction of trabecular beams with tissue scrolling at the edges of the treated areas.