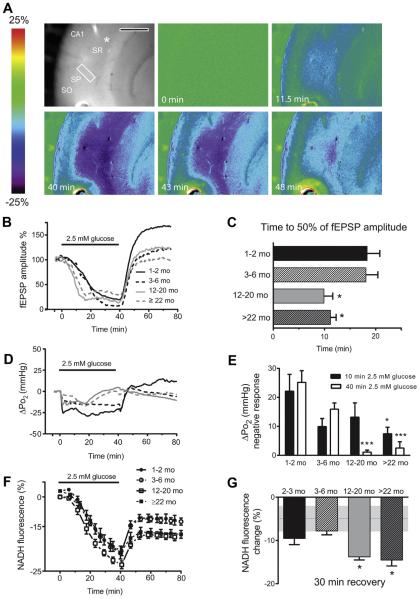
Fig. 1.
Effect of moderate glucose deprivation (2.5 mM) on field excitatory post-synaptic potentials, NADH fluorescence, and tissue Po2 n the CA1 region of hippocampal slices, at 4 different ages across the life span. (A) The top left shows an unsubtracted camera image of the hippocampal CA1 region. The recording electrode is positioned next to the oxygen sensor, indicated by the white asterisk. Scale bar = 500 mm. The imaging region of interest (ROI; a white rectangle) is positioned in the stratum radiatum between the stimulating and recording electrode. The stratum pyramidale (SP), the stratum oriens (SO), and stratum radiatum (SR) are also indicated. Next are a series of pseudocolor images of NADH fluorescence at different times during and after exposure to 2.5 mM glucose in hippocampal slices exposed to 95% O2. Low-glucose conditions resulted in a decline of NADH fluorescence because of a decrease in substrate availability (at 11.5 minutes). Then NADH fluorescence starts to recovers toward baseline levels after the slices were returned to the control buffer (after 40 minutes). (B) Mean time-course of fEPSP amplitudes during 40 minutes low glucose (2.5 mM) condition and recovery. (C) Data summary: in hippocampal slices obtained from 12- to20-month-old rats fEPSP amplitudes declined significantly earlier compared with 1- to 2-month-old rats (*p < 0.05 vs. 1–2 months; 1-way ANOVA followed by Tukey multiple comparisons test). Data are the mean ± SEM of 10, 5, 5, and 7 slices/condition in 1–2, 3-6, 12-20, and >22 months rats, respectively. (D) Mean time-course of tissue Po2 during 40 minutes low-glucose (2.5 mM) condition and recovery. (E) Data summary of tissue Po2 decline at 10 and 40 minutes after glucose deprivation (*p < 0.05 and ***p < 0.001 vs. 1–2 months; 2-way ANOVA followed by Tukey multiple comparisons test). Data are the mean ± SEM of 6, 3, 4, and 5 slices/condition in 1–2, 3–6, 12–20, and >22 months rats, respectively. (F) Averaged traces of NADH fluorescence changes over time. (G) Data summary: changes of NADH fluorescence from baseline were calculated 30 minutes after recovery in control buffer (10 mM glucose). In hippocampal slices obtained from 12 to 20 and >22 months old rats NADH levels remain lower than in younger rats (*p < 0.05 vs. 1–2 months; 1-way ANOVA followed by Tukey multiple comparisons test). Data are the mean ± SEM of 9, 5, 9, and 6 slices/condition in 1–2, 3–6, 12–20, and >22 months rats, respectively. The gray dotted line indicates average NADH fluorescence changes ± SEM in control slices at equivalent time. Abbreviations: ANOVA, analysis of variance; fEPSP, field excitatory postsynaptic potential; SEM, standard error of the mean. (For interpretation of the references to color in this Figure, the reader is referred to the web version of this article.)

