
Figure 3.
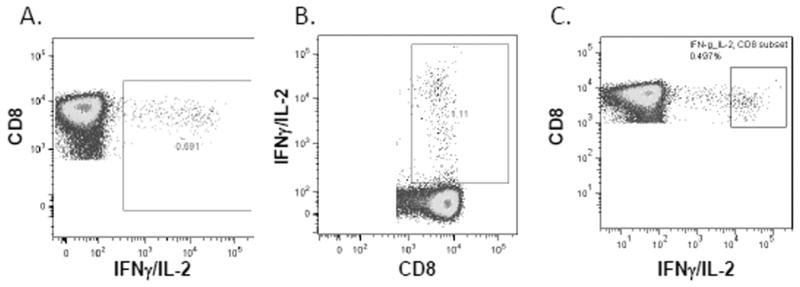
Different approaches to the placement of cytokine-positive gate. Actual graphs from different participating laboratories, all of the examples are from the same FCS file, Donor 2, CEF stimulated. (A) An example of a cytokine gate with adequate proximity. (B) A cytokine gate that is too close to the negative population. (C) A cytokine gate that is drawn too far from the negative population, missing many cytokine-positive cells. [Color figure can be viewed in the online issue, which is available at wileyonlinelibrary.com.]