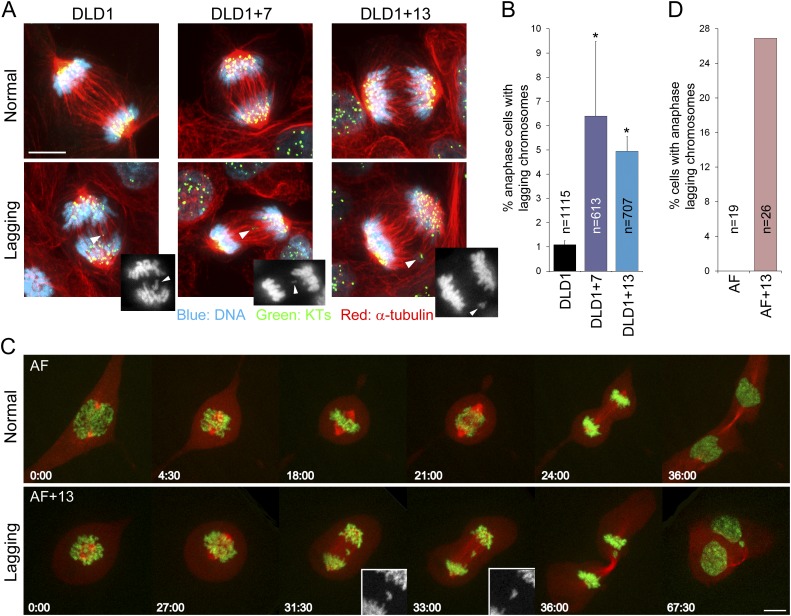
Figure 2. Increased rates of anaphase lagging chromosomes in cells with trisomy 7 or 13.
(A) Examples of normal anaphases (top row) and anaphase cells with lagging chromosomes (bottom row). Cells were immunostained for microtubules (red) and kinetochores (green). DNA is shown in blue. Images represent maximum intensity projections of Z-stacks. Arrowheads point at anaphase lagging chromosomes. Grey scale images at the bottom right corners of the images in the bottom row are single focal planes of DAPI-stained chromosomes shown for easier visualization of the lagging chromosomes. (B) Frequencies of anaphase lagging chromosomes were significantly higher (*χ2 test, p < 0.0001) in both DLD1+7 and DLD1+13 compared to DLD1 cells. Data are reported as mean ± S.E.M and represent the average of three independent experiments in which a total of 613–1115 anaphases were analyzed. (C) Time-lapse microscopy of AF and AF+13 cells undergoing mitosis. An example of AF undergoing normal mitosis is shown in the top row and an example of AF+13 displaying an anaphase lagging chromosome is shown in the bottom row. DNA is shown in green (H2B-GFP) and microtubules in red (RFP-tubulin). Images are maximum intensity projections of Z-stacks. Insets in the bottom row display enlarged views of the DNA alone (in grey scale) in the region around the lagging chromosome. (D) None of the 19 AF cells (from cases #1 and #2) imaged displayed anaphase lagging chromosomes, whereas 7 out of 26 AF+13 cells (5 out of 18 in case #1 and 3 out of 8 in case #2) displayed anaphase lagging chromosomes. Time stamps indicate elapsed time in min:sec. Scale bars, 5 μm.


