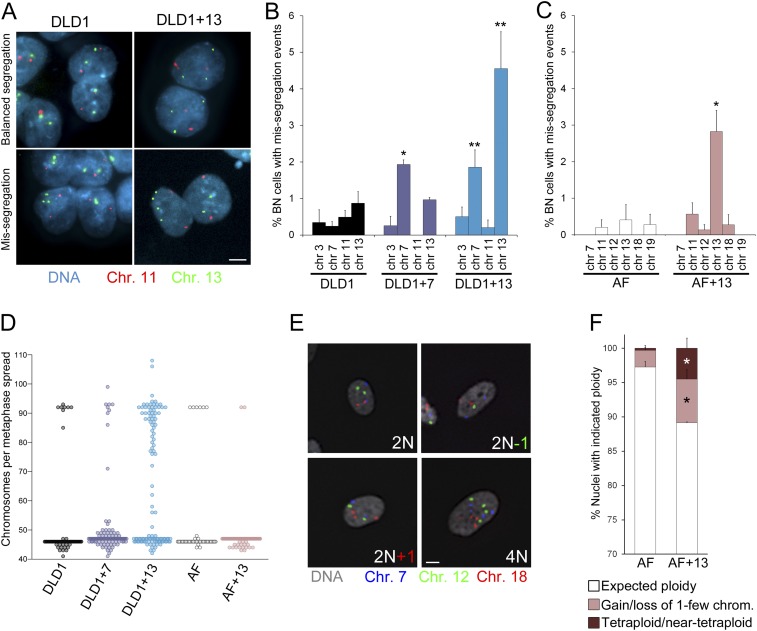
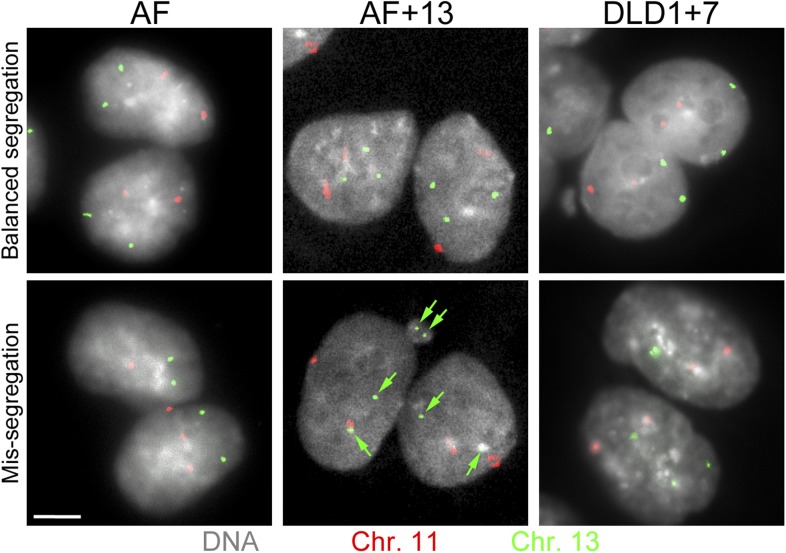
Figure 3. Increased chromosome mis-segregation rates and karyotypic heterogeneity in cells with trisomy 7 or 13.
(A–C) Combination of cytokinesis-block assay and FISH staining with chromosome-specific probes shows higher chromosome mis-segregation rates in DLD1+7 and DLD1+13 compared to DLD1 cells and AF+13 compared to AF cells. (A) Examples of FISH-stained binucleate (BN) DLD1 and DLD1+13 cells. Scale bar, 5 μm. (B–C) Frequencies of BN cells displaying mis-segregation events. *Two-tailed χ2 test, p < 0.005; **two-tailed χ2 test, p < 0.0001, when compared to mis-segregation of the same chromosome in the euploid cell line. Data are presented as mean ± S.E.M. and represent the average of at least three independent experiments/samples in which a total of 460–1229 BN cells were analyzed. (D) Beeswarm plot displaying data from chromosome counts in metaphase spreads from the five cell lines. DLD1+7, DLD1+13, and AF+13 (modal chromosome number 47, shown by the high concentration of sampled points) displayed increased karyotypic heterogeneity compared to DLD1 and AF cells (modal chromosome number 46, shown by the high concentration of sampled points), respectively. In addition, DLD1+13 cells displayed a large sub-population of near-tetraploid cells (modal chromosome number 92). Chromosome counts were performed on 89–303 metaphase spreads. (E–F) FISH staining with chromosome-specific probes in interphase nuclei reveals higher rates of aneuploidy and tetraploidy in AF+13 vs AF cells. (E) FISH staining in interphase AF and AF+13 cells with probes specific for chromosomes 7 (blue), 12 (green), and 18 (red). Scale bar, 5 μm. (F) Quantification of interphase FISH data shown in (E). Cells were classified as having gained or lost 1-few chromosomes or as tetraploid (4 signals for each of the three chromosomes analyzed). The data show a larger fraction of cells with gain/loss of 1-few chromosomes in the AF+13 population compared to AF cells (*χ2 test, p < 0.0001). Additionally, AF+13 cells displayed a larger sub-population of tetraploid cells (*χ2 test, p < 0.0001). Data are presented as mean + S.E.M. and represent the average of three different samples in which a total of 2,117–2,410 cells were analyzed.


