
Figure 11.
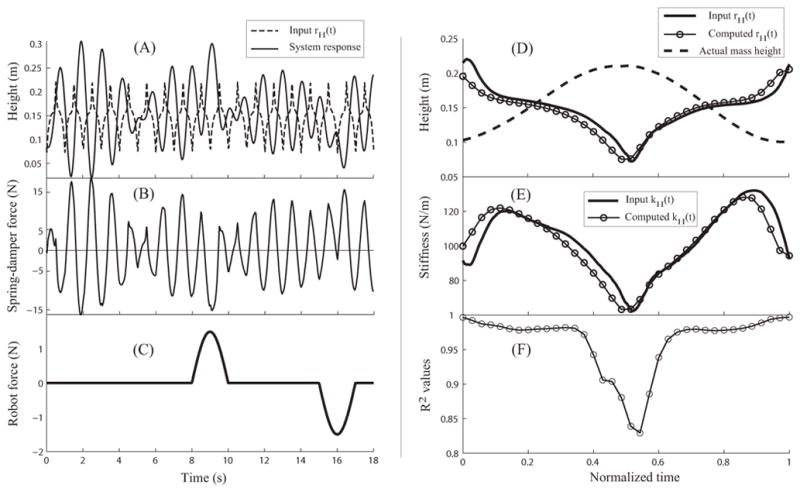
Simulation inputs and results. Panel A shows the input referent height for the oscillating mass (dotted trace). The solid trace is the response of the mass-spring-damper system. Panel B shows the spring-damper-induced force on the mass. Panel C depicts the robot force. Panel D shows the actual mass height averaged across cycles (dashed trace). The computed and input referent heights are also depicted. Panel E shows the input and the computed spring stiffness. Panel F shows the R2 values obtained from the regressions performed on discrete Poincare sections. The locations of the circles in panels D, E and F indicate the phases at which regressions were performed during the reconstruction process.