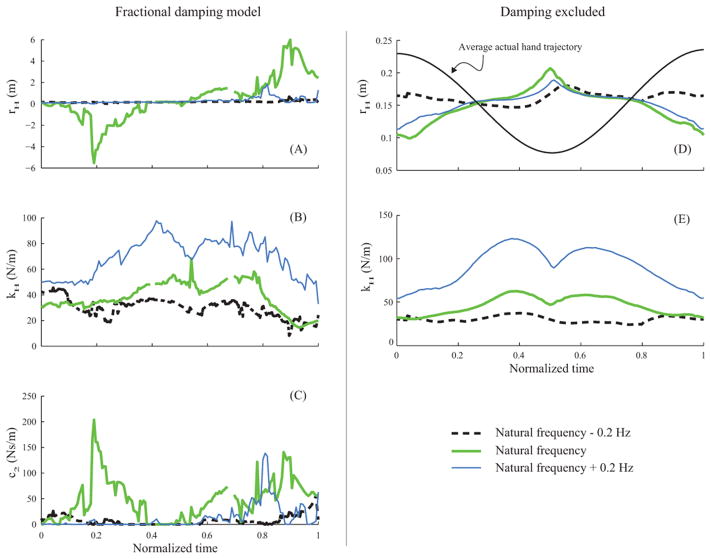
Figure 5.
Trajectories of the referent variables and damping computed for vertical handle oscillation for a representative subject. Figures (A), (B), and (C) show the referent height rH, apparent stiffness kH, and damping c2, respectively, for three oscillation frequencies computed using a fractional damping regression model. The exponent α for the damping term was 0.71, 0.04, and 0.16 for the movement frequencies fn − 0.2, fn, and fn + 0.2 Hz, respectively. Figures (D) and (E) show the referent height and the apparent stiffness for the same data computed using a damping-free regression model. Figure (D) also depicts the average (computed across all movement frequencies) trajectory of the actual hand movement. The natural-frequency curves in figures A, B, and C show missing data. At these locations, the regression was not significant, and hence these data were not included.

