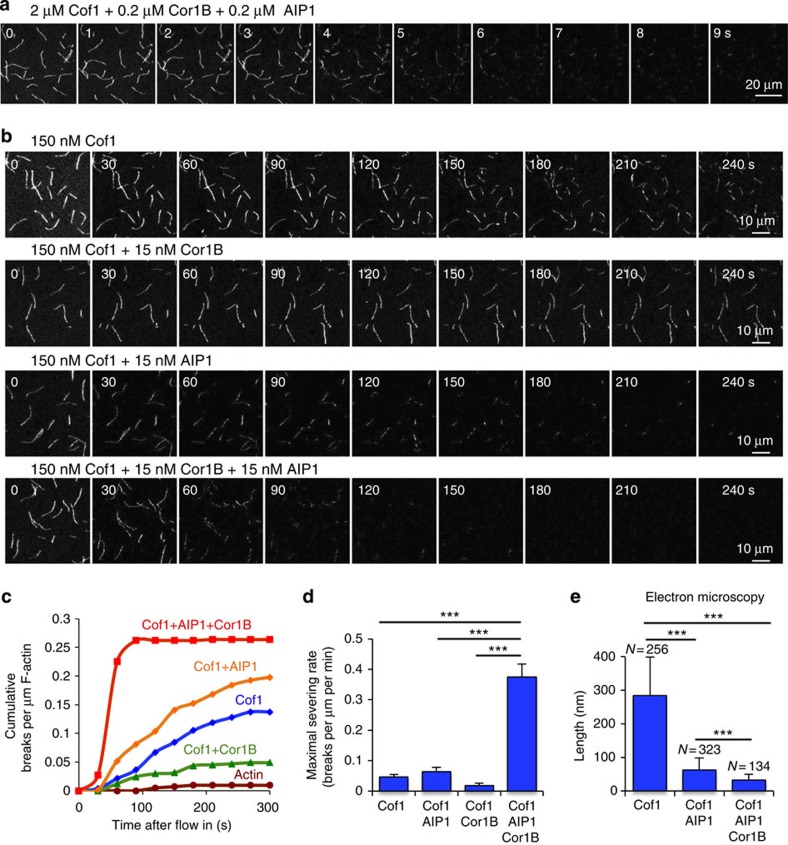
Figure 1. High rates of actin filament severing in the combined presence of mammalian Cof1, Cor1B and AIP1.
(a) Time points from TIRF microscopy (Supplementary Movie 1) of pre-polymerized OG-labelled actin filaments after flowing in a mixture of the indicated concentrations of Cof1, Cor1B and AIP1. (b) Time points from TIRF microscopy (Supplementary Movie 2) as above, except flowing in lower concentrations (as indicated) of Cof1, Cor1B and/or AIP1. (c) Analysis of filament severing kinetics from TIRF assays performed as above. Each data point is the cumulative number of severing events per micron of filament at that time point, averaged for at least 60 filaments pooled from 3 independent trials of at least 20 filaments each. (d) Maximal rates of severing for each condition were determined by averaging the slopes of curves from three independent trials in the time interval from 30 to 60 s. Slope measurements at later time points confirmed that these were the maximal rates during the 300-s observation window. Error bars, s.d. (e) Electron microscopy of actin filament severing products. F-actin (2 μM) was incubated with different combinations of 2 μM Cof1, 0.2 μM Cor1B and 0.2 μM AIP1, then imaged by negative stain electron microscopy (examples of images in Supplementary Fig. 2). Average filament length (±s.d.) is graphed with the number of filaments analysed (N) above each bar. Statistical significance and P values for d,e were determined by analysis of variance and Tukey's multiple comparison test; ***P<0.05.

