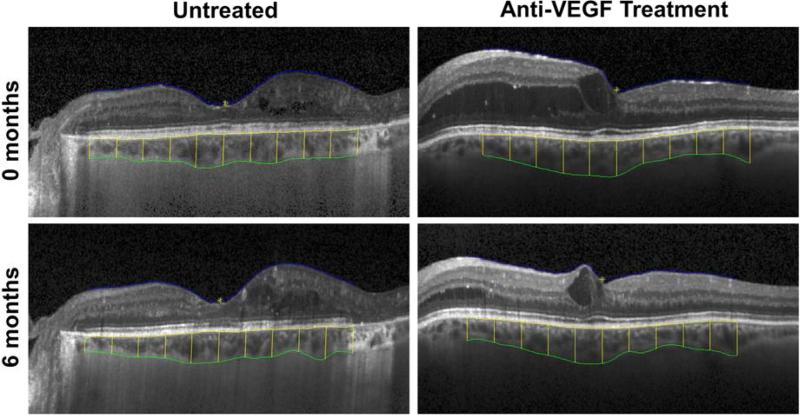
Figure 1. Semi-automated Segmentation of Retinal and Choroidal Thickness on Enhanced-Depth Imaging Optical Coherence Tomography.
Images show the inner border of the retinal surface (blue), outer border of the RPE (yellow), and outer border of the stromal choroid (green), with vertical lines indicating choroidal thickness measurements at 0.5mm intervals from 2.5mm nasal to 2.5mm temporal to the fovea. Images are taken from a sample eye with untreated diabetic macular edema at 0 and 6 months (top left and bottom left) and another eye treated with anti-VEGF at 0 and 6 months (top right and bottom right).

