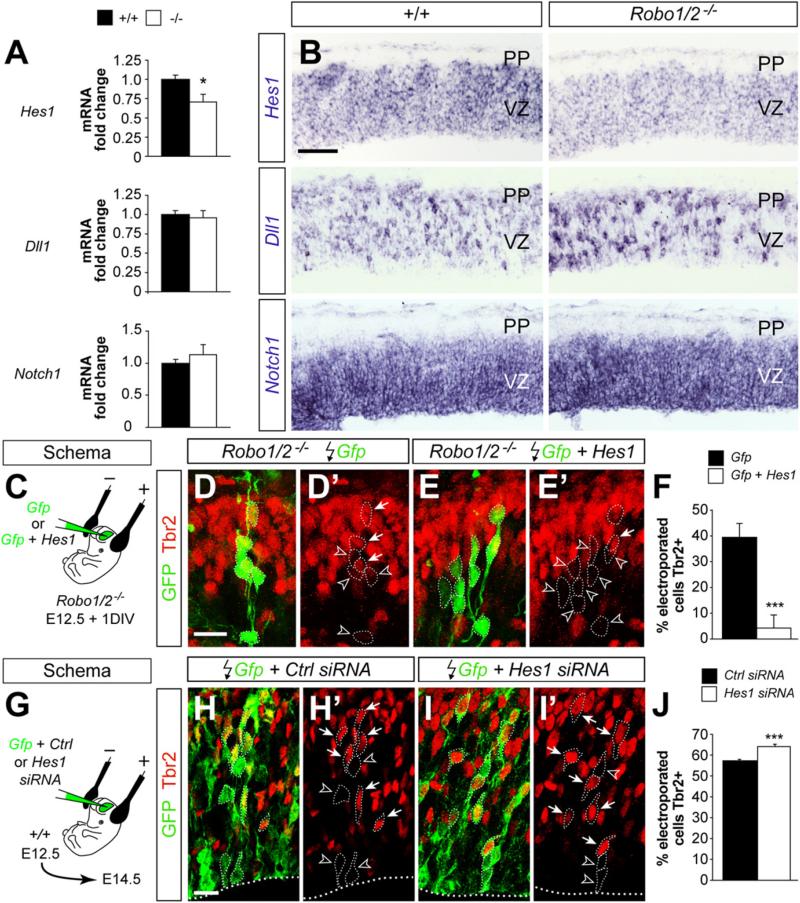
Figure 7. Robo Signaling Is Required for Normal Hes1 mRNA Expression.
(A) qPCR measurements of Hes1, Dll1, and Notch1 mRNA expressed as values relative to control embryos (n = 3–5 embryos per group). t test. *p < 0.05.
(B) Coronal sections of the neocortex of E12.5 control and Robo1/2 mutant embryos showing expression of Hes1, Dll1, and Notch1 mRNA.
(C) Experimental paradigm used for rescue experiments.
(D–E′) Coronal sections through the cortex of E12.5 + 1DIV Robo1/2 mutant embryos showing GFP and Tbr2 stains after electroporation with Gfp or Gfp + Hes1.
Images are full stacks of confocal planes. Arrows and arrowheads point to Tbr2+ and Tbr2– cells, respectively, as assessed from individual confocal plane images.
(F) Quantification of the fraction of Tbr2+ cells present among the Gfp electroporated population. Tbr2+/Gfp+ cell ratio, Gfp: 39.2 ± 5.6%, n = 628 cells from three different animals; Gfp + Hes1: 4.3 ± 1.3%, n = 1035 cells from three different animals. Mean ± SEM; χ2-test, ***p < 0.001.
(G) Experimental paradigm used for RNAi experiments.
(H–I′) Coronal sections through the cortex of E14.5 wild-type embryos showing Gfp and Tbr2 stains after electroporation with Gfp or Gfp + Hes1 siRNA. Images are full stacks of confocal planes. Arrows and arrowheads point to Tbr2+ and Tbr2– cells, respectively, as assessed from individual confocal plane images.
(J) Quantification of the fraction of Tbr2+ cells present among the Gfp electroporated population. Tbr2+/Gfp+ cell ratio, Gfp: 57.3 ± 0.6%, n = 2354 cells from three different animals; Gfp + Hes1: 64.1 ± 1.1%, n = 1949 cells from four different animals. Mean ± SEM; χ2-test, ***p < 0.001.
Scale bar equals 100 μm (B), 25 μm (D–E′), and 15 μm (H–I′). See also Figure S8.

