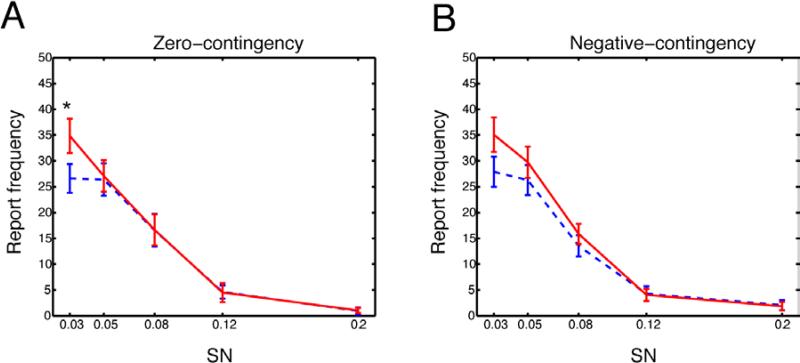
Fig. 5.
Report frequencies toward the positive-contingency orientation in the incorrect trials of the neutral-contingency trials (Fig. 5A) and negative-contingency trials (Fig. 5B). Dashed blue curves indicate the pre-test and solid red curves indicate the post-test. SN represents a S/N ratio. Error bars are standard errors.

