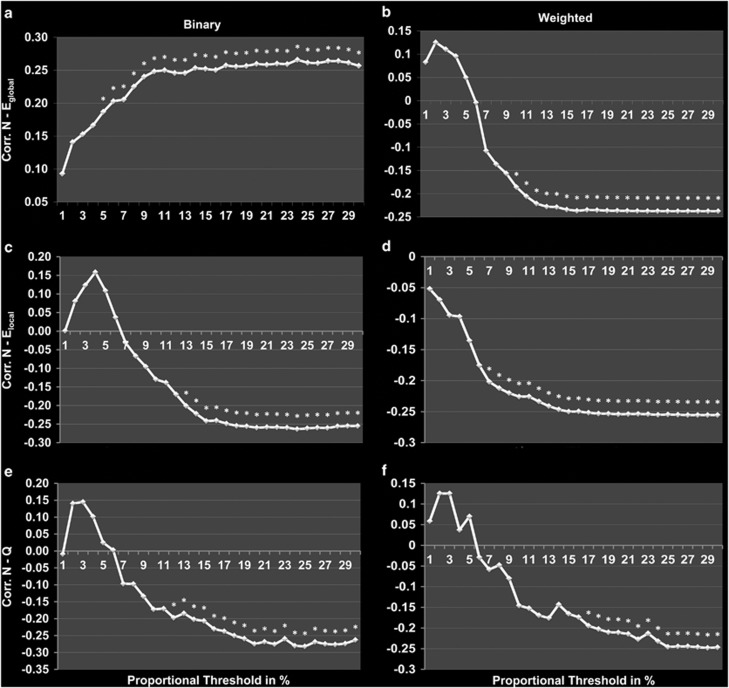
Figure 1.
Correlations between neuroticism and the whole-brain network measures. In the panels, correlations between neuroticism, and global efficiency (Eglobal) (a, b), local efficiency (Elocal) (c, d), and maximized modularity (Q) (e, f) can be observed over a range of threshold values (T=0.01–0.30, in increments of 0.01) for binary (a, c, and e) and weighted graphs (b, d, and f). Significant correlations (p<0.05, uncorrected for the number of threshold values) are marked with an asterisk (*).

