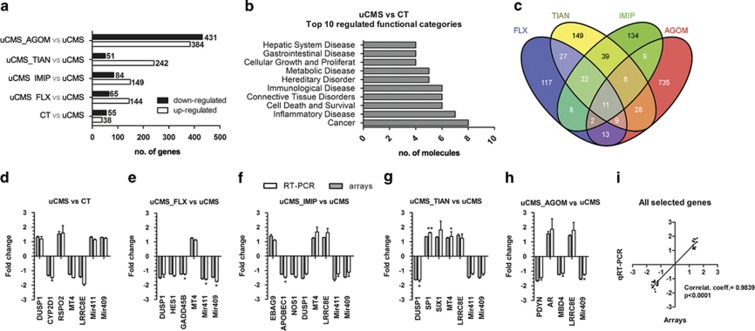
Figure 3.
Microarray analysis of the DG of Control, uCMS-exposed and antidepressant-treated rats. (a) The number of upregulated and downregulated genes in uCMS vs CT animals and in AD-treated vs uCMS animals. (b) Top 10 significantly enriched functional categories identified with Ingenuity Pathway Analysis (IPA) Software in uCMS-exposed vs Control animals. Shown are the terms with the highest number of genes, as indicated by the bars. (c) Venn diagram depicting the number of significantly regulated transcripts (p<0.01, fold change (FC)>1.2 × , average expression>100) after 2 weeks of AD treatment and overlap between treatments. (d–h) Confirmation of the microarrays data was performed by qRT-PCR of selected genes, for each relevant comparison. White bars depict the linear FC of mRNA levels between the respective experimental groups after normalization to B2M/RNU6 (microRNAs) mRNA levels; Grey bars depict the observed linear FC in the Affymetrix microarrays. Error bars denote SEM. *Denotes statistical differences between groups for each relevant comparison after normalization to B2M/RNU6 mRNA levels; *p<0.05; n=3 per group. (i) Linear regression analysis of FC from microarrays and qRT-PCR of all selected genes for confirmation. Correlation coefficient and p-value are indicated in the graph. AGOM, agomelatine; CT, control; FLX, fluoxetine; IMIP, imipramine; TIAN, tianeptine; uCMS, unpredictable chronic mild stress.

