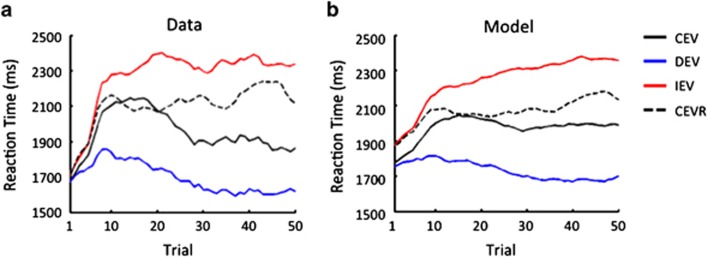
Figure 3.
(a) Shown are the average reaction times across all 64 genotyped subjects for each of the four conditions, smoothed by a 10-trial weighted average. As evident in the plots, subject behavior strongly differentiated the four conditions (F(2.6,165.1)=7.8, p≪1.0 × 10⁻³, Greenhouse-Geiser corrected). (b) Model predictions for the average reaction time across trials for all 64 genotyped subjects.

