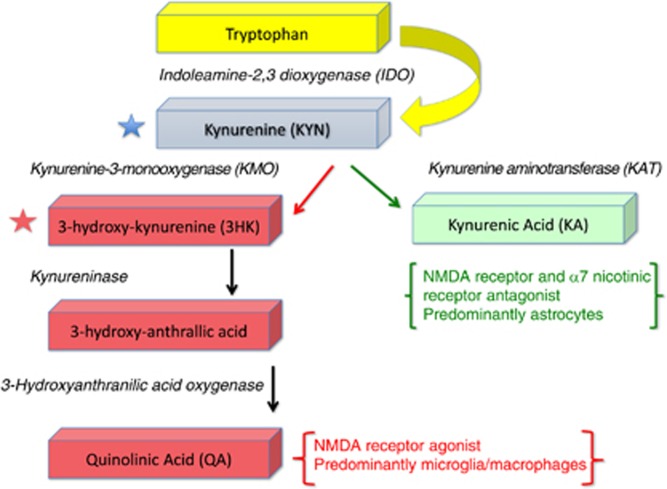
Figure 1.
Main branches of the kynurenine pathway. Each box represents a metabolite resulting from the oxidation of tryptophan. Putative neurotoxic metabolites are colored red whereas KA, which is putatively neuroprotective, is colored green. The black italicized text shows the enzymes that catalyze each step in the metabolic pathway. The blue and red stars indicate that the metabolite is able to cross the blood–brain barrier. The effects on NMDA receptor activity listed for some metabolites have been established in vitro, but the extent to which the metabolite concentrations achieve sufficiently high levels in vivo to impact the function of this receptor system remains unclear. NMDA, N-methyl-D-aspartate glutamate receptor. A full text version of this figure is available at Neuropsychopharmacology Journal online.

