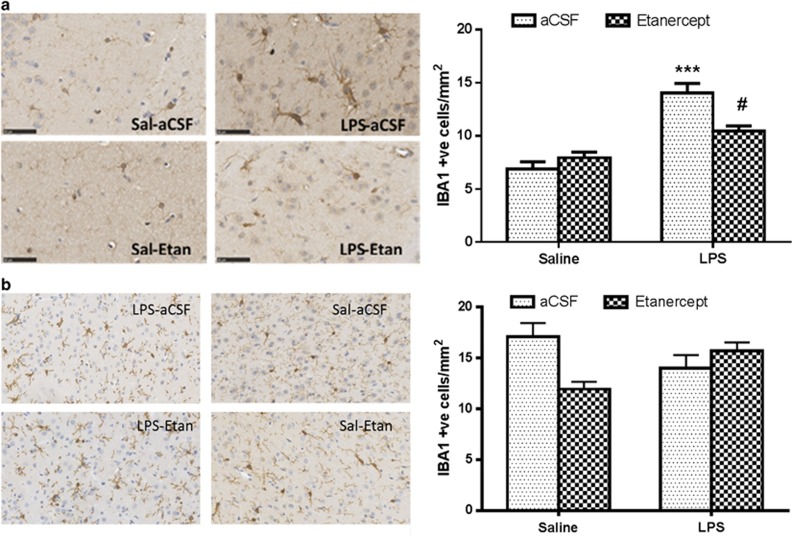
Figure 6.
Microglia counts across experimental conditions. (a) The figure shows IHC images of the microglia in the dentate gyrus while the graph represents the number of IBA1-positive cells in the dentate gyrus. (b) The figure shows IHC images of the microglia in the PFC while the graph represents the number of IBA1-positive cells in the PFC. All data represent mean±SEM (n=5/group, Sal-aCSF: saline treatment IP with aCSF administered ICV, Sal-Etan: saline treatment IP with etanercept administered ICV, LPS-aCSF: LPS challenge IP with aCSF administered ICV, LPS-Etan: LPS challenge IP with etanercept administered ICV). Data compared using two-way ANOVA ((a) Interaction: P=0.0041, Saline/LPS challenge: P<0.001, aCSF/etanercept: P=0.08; (b) Interaction: P=0.02, Saline/LPS challenge: P=0.81, aCSF/etanercept treatment: P=0.22). ****P<0.001 LPS-aCSF compared with Sal-aCSF, #P<0.05 LPS-Etan compared with LPS-aCSF, analyzed by Bonferroni's multiple comparisons.

