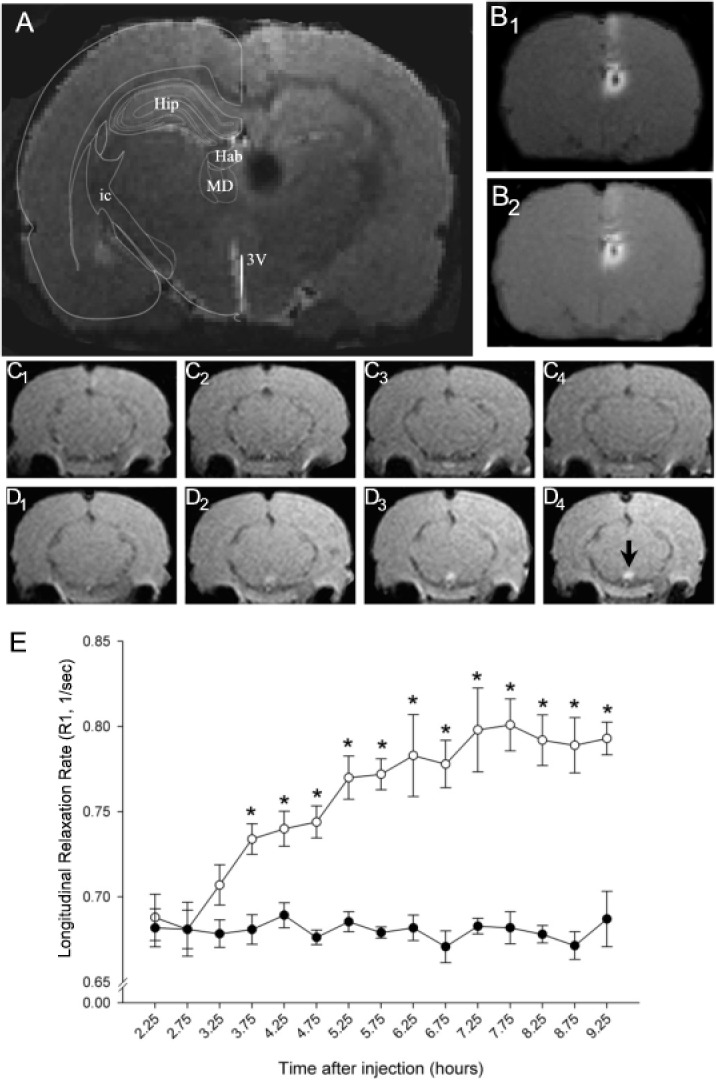
Fig 1. Time course of Mn2+ transport through the habenulomesencephalic pathway.

(A) Anatomical MR image illustrating the site of unilateral infusion of MnCl2 into the dorsal diencephalon. The injection site, which appears as a black circle on the right side of the image, encompassed the entire habenula and a portion of the mediodorsal nucleus of the thalamus. An overlay adapted from the atlas of Paxinos and Watson [32] is positioned on the left side of the image for orientation. Abbreviations: Hip-hippocampus; Hab—habeunla; MD—mediodorsal nucleus of the thalamus; ic—internal capsule; 3V – 3rd ventricle. (B) Corresponding T1 weighted images showing the distribution of Mn2+hyperintensityat the injection site 2.5 hours (B1) and 9 hours (B2) after infusion. (C-D) Representative coronal sections of the caudal midbrain at 0, 2, 4, and 6 hours (1–4, respectively) after the start of the imaging study in a sham control (C) and MnCl2-injected rat (D). Note the time-dependent increase in MR signal intensity in the IPN beginning 3.25 hours following the start of MnCl2 injection into the Hb (cf. region below black arrowhead in image D4). MRI images presented in A,B and D were obtained from the same rat. (E) Summary of the changes in longitudinal relaxation rate (ordinate) within the IPN as a function of the time (in hours) after MnCl2 injection in the Hb (abscissa). Each point represents the arithmetic mean ± SEM of 8–11 animals. Asterisks denote a significant difference from sham injection controls.
