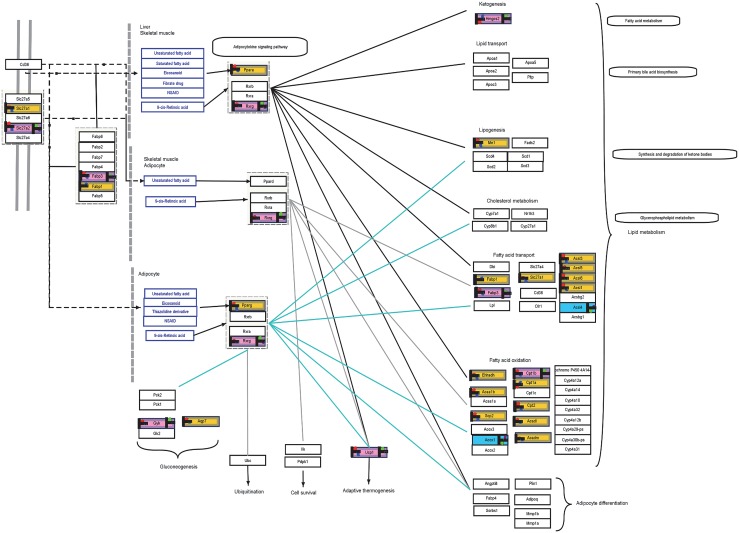
Fig 2. PPAR signaling pathway representing similar expression in both organisms.
Yellow blocks represent expression particularly in mice while blue represent expression particular to human. Pink blocks represent expression in both organisms. The heat strips on the left of the colored bocks represent normalized signal intensity (P≤0.05, Red—expression in BAT, Blue—Expression in sWAT) in the respective tissue of LACA mouse. The heat strips on the left of the colored bocks represent normalized signal intensity (P≤0.05, Green—expression in BAT, Purple—Expression in sWAT) in the respective human tissues.

