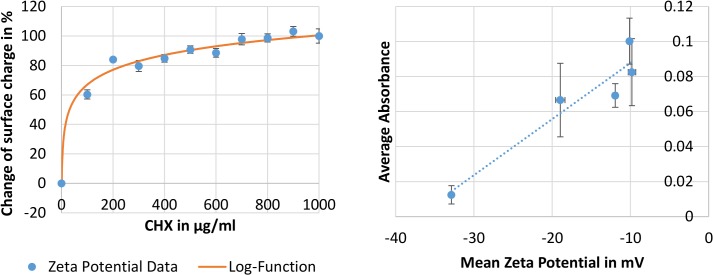
Fig 1. Zeta potential data (surface charge) for M. luteus loaded with CHX-hydrochloride over a range of concentrations from 0 μg/ml to 1000 μg/ml CHX.
The data has been normalized (0%-100% equals an increase of the zeta potential from -32.86 ± 1.88 mV to -9.63 ± 2.22 mV) in order to fit a logarithmic function (%ζ = 33.48•log(CHX-concentration)). The panel on the right shows correlation of the measured zeta potential (x-axis) with the measured absorption of CHX in the lysate (y-axis). A linear trend with an R2 value of 0.9045 is also shown.

