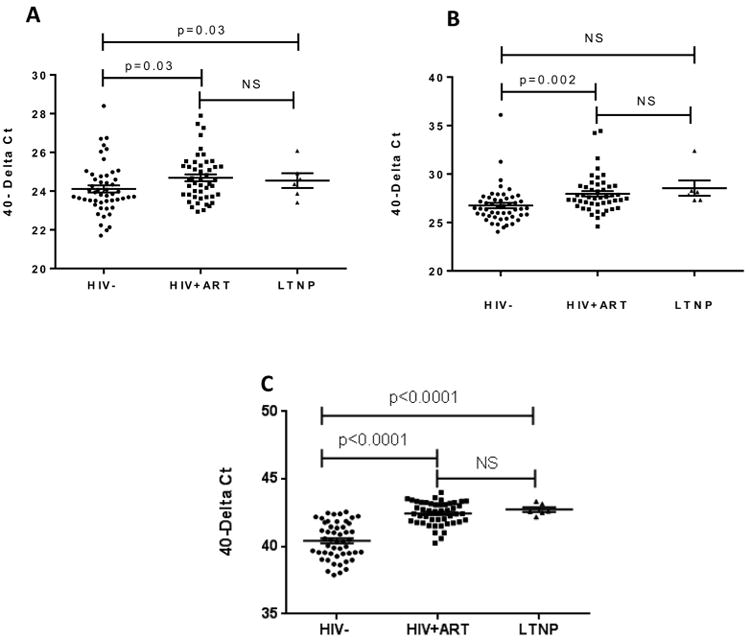
Figure 1. Comparison of baseline gene expression in PBMCs.

PBMCs from three patient groups (HIV negative controls, HIV+ ART patients, and LTNPs) were treated with 6 μL of Lipofectamine 2000 (mock transfection) for 22 hours. Total RNA was extracted and subjected to qRT-PCR. Baseline gene expression levels of IFN-λ1 (A), IFN-β (B) and RANTES (C) were calculated by comparing the Ct values of the gene of interest with the Ct value of GAPDH and subtracting this from 40 (40-delta Ct).
