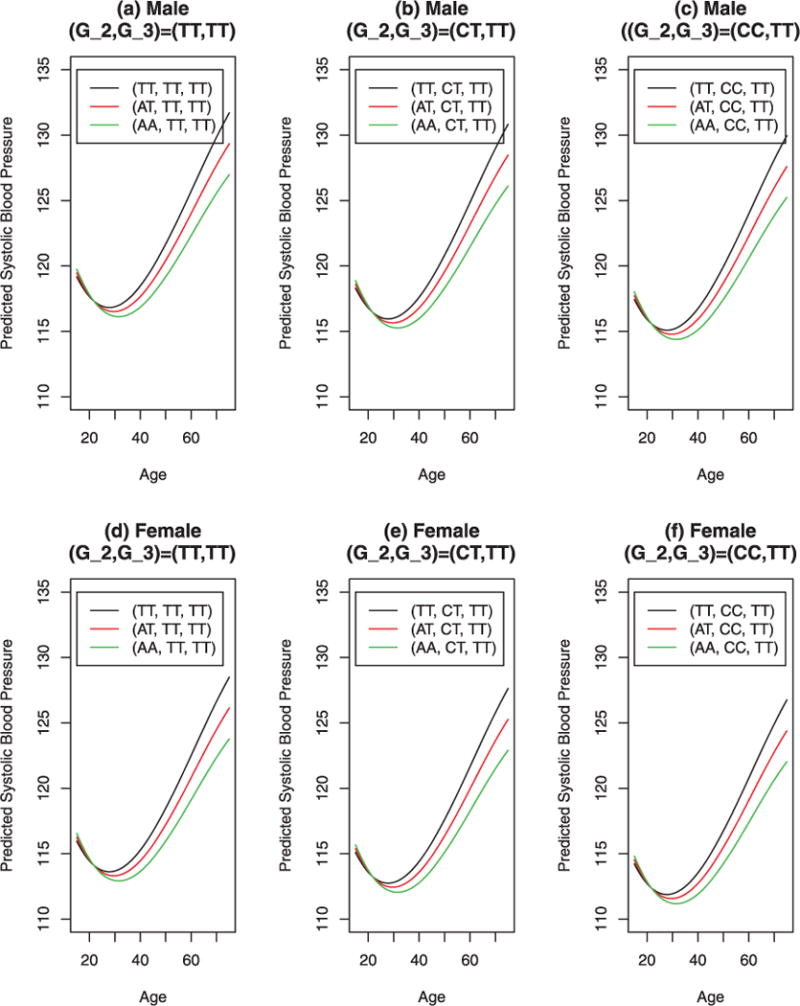
Fig. 2.

Predicted systolic blood pressure against age in years for male and female by SNPs M1 = rs17249754, M2 = rs11024074, M3 = rs3184504, and sex, based on parametric model (12). In the graphs, the legends give the genotypes of the three SNPs; for instance, (AT, CT, TT) means G1 = AT, G2 = CT, and G3 = TT. Gi is the genotype of Mi, i = 1, 2, 3.
