Fig. 4.

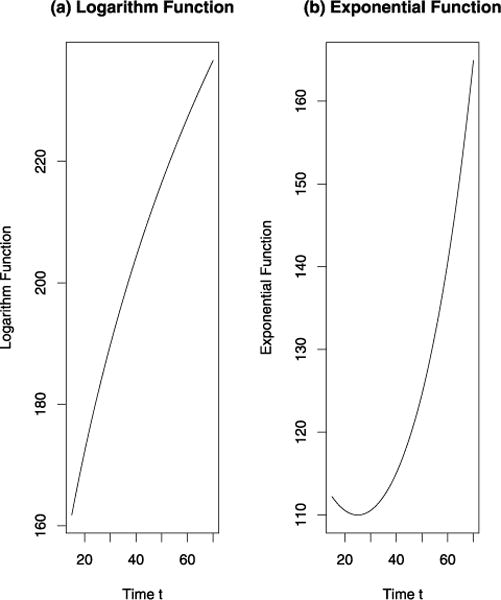
The curves of (a) logarithm function μ(t) = −34.2 + 81.7 log(0.3(t + 21.7)) and an (b) exponential function μ(t) = 110 exp(0.0002 × (t − 25)2)).

The curves of (a) logarithm function μ(t) = −34.2 + 81.7 log(0.3(t + 21.7)) and an (b) exponential function μ(t) = 110 exp(0.0002 × (t − 25)2)).