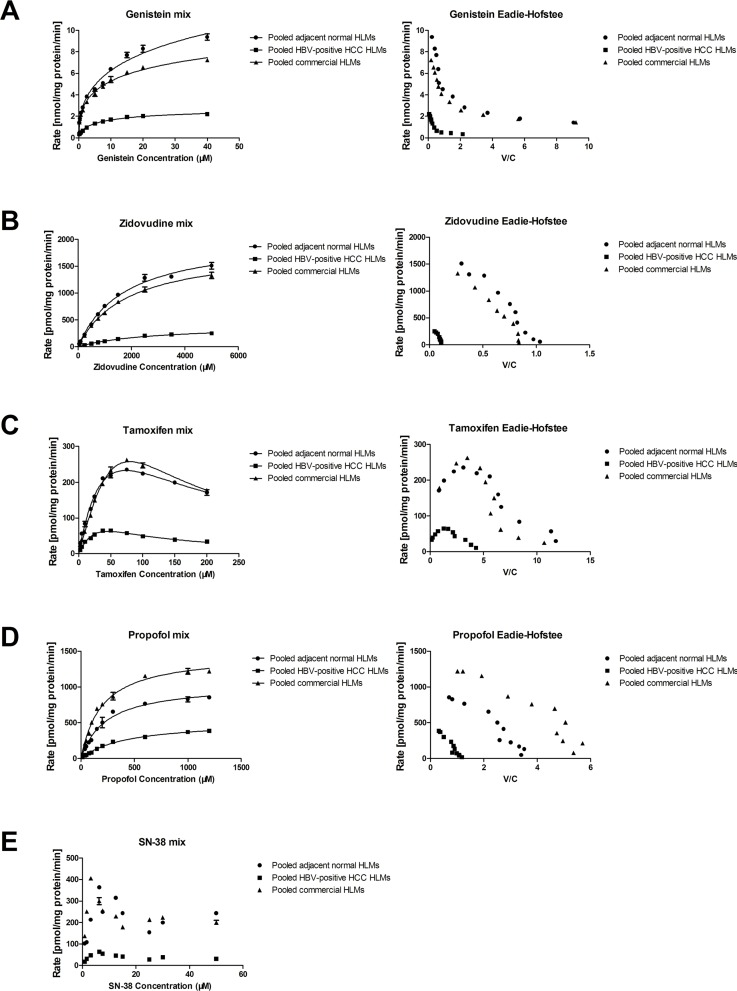
Fig 1. The kinetics of each specific substrate glucuronidation in pooled commercial, adjacent normal and HBV-positive HCC human liver microsomes.
(A) Metabolism kinetics of genistein in commercial, adjacent normaland HBV-positive HCC HLMs (n = 5). (B) Metabolism kinetics of zidovudine in commercial, adjacent normal and HBV-positive HCC HLMs (n = 5). (C) Metabolism kinetics of tamoxifen in commercial, adjacent normal and HBV-positive HCCHLMs (n = 5). (D) Metabolism kinetics of propofol in commercial, adjacent normal and HBV-positive HCC HLMs (n = 5). (E) Metabolism kinetics of SN-38 in commercial, adjacent normal and HBV-positive HCC HLMs (n = 5). Each data point represents the average of three determinations. Representative data from three independent experiments are shown as the mean ± S.D.

