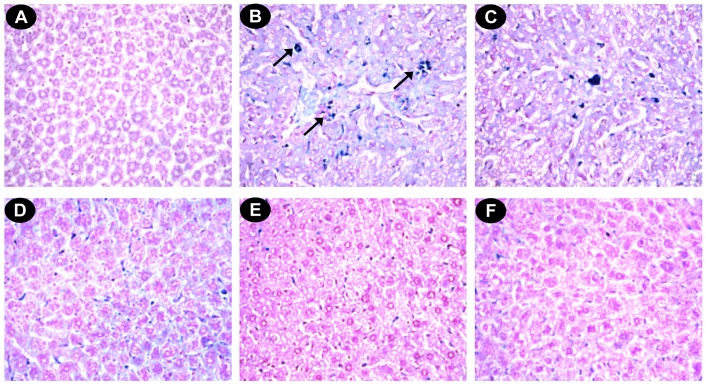
Fig 8. Photomicrograph of mice liver sections (Perls’ staining) ×400.
(A) Control mice liver. (B) Iron-overloaded (iron dextran, 100 mg/kg b.w.) liver section showing hemosiderin in blue (indicated by arrows) (C) Liver section treated with iron dextran + 50 mg/kg b.w. DBME shows less hemosiderin. (D) Liver section treated with iron dextran + 100 mg/kg b.w. DBME. (E) Liver section treated with iron dextran + 200 mg/kg b.w. DBME. (F) Liver section treated with iron dextran + 20 mg/kg b.w. desirox shows nearly no hemosiderin. S100 and S200 show very less hemosiderin indicating a trend of restoration of healthy liver with reduced iron content.

