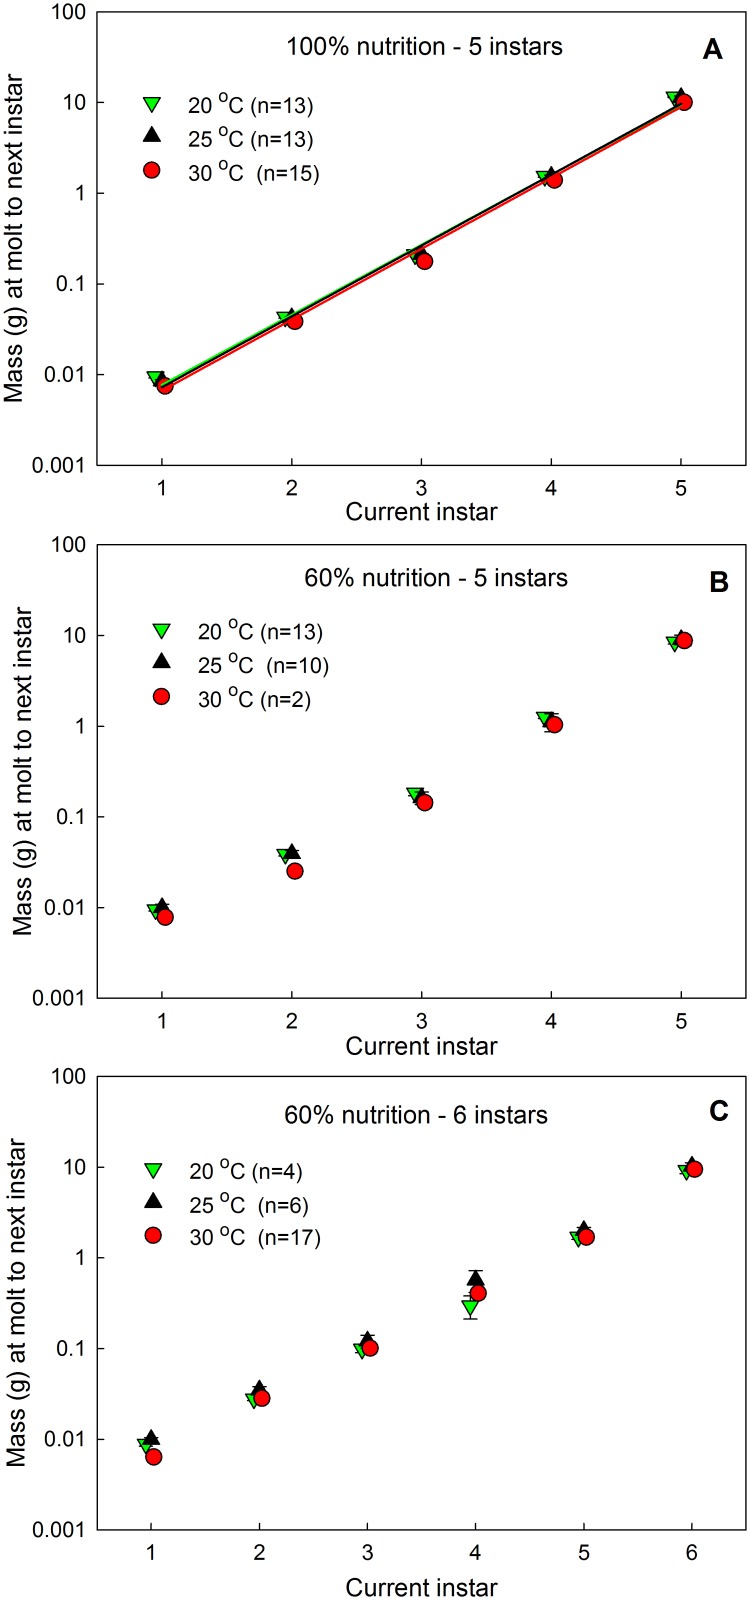
Fig 1. Dyar relationships between instar number and mass at the end of that instar.
(A) Wild-type strain at normal nutrition and different temperatures. Exponential regressions are shown and given by: for 20°C, 0.0013e1.778 r2 = 0.995; for 25°C, 0.0012e1.798s r2 = 0.997; for 30°C, 0.001e1.799 r2 = 0.996. (B) Wild-type strain growing on low nutrient diet and different temperatures undergoing 5 larval instars. (C) Wild-type strain growing on low nutrient diet and different temperatures undergoing 6 larval instars. Bars are SEMs and are mostly smaller than the symbols.

