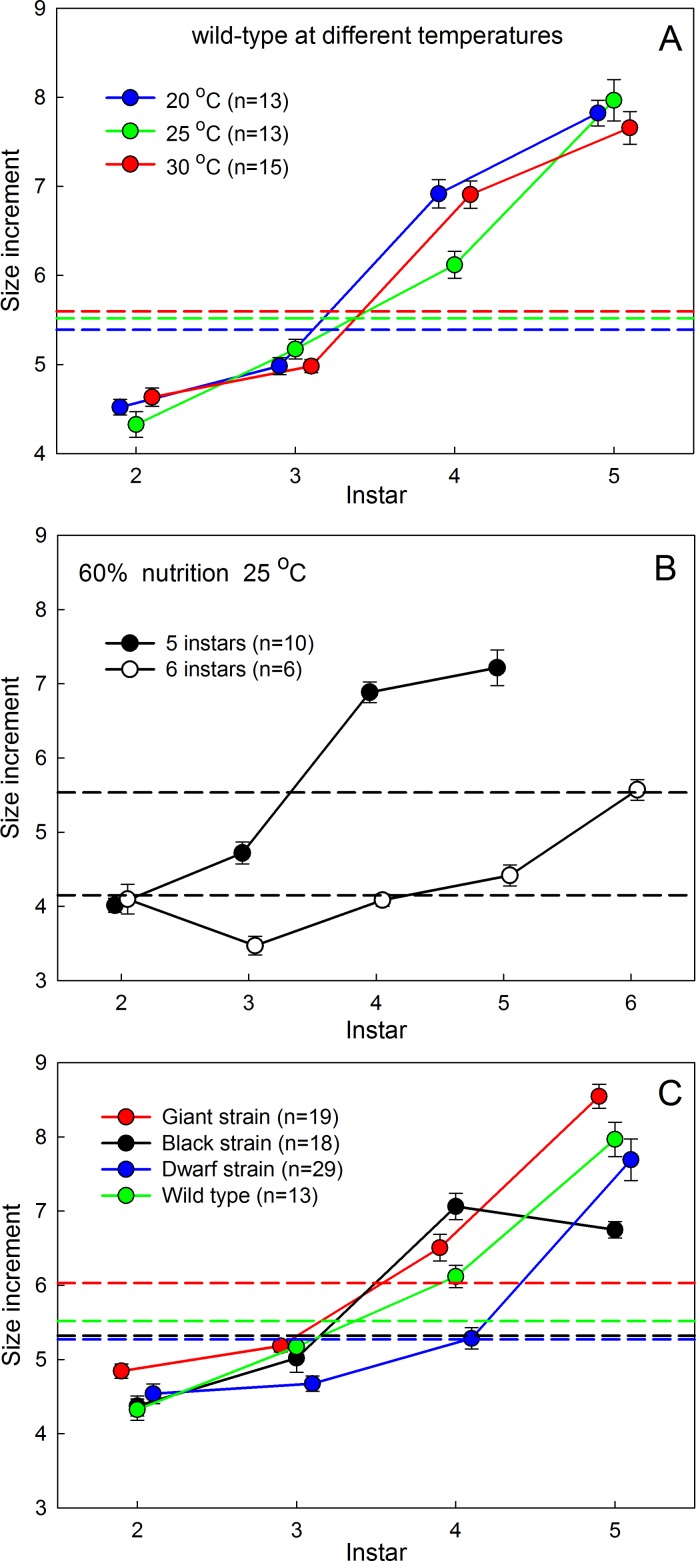
Fig 2. Size increments at each molt.
(A) The wild-type strain at different temperatures. (B) The wild-type strain at 25°C under reduced nutrient condition undergoing either 5 or 6 larval and instars. (C) Three genetic strains (and wild type from A) with different adult body sizes at 25°C. Dashed lines show the corresponding (constant) values of the size increments predicted by the Dyar coefficient if Dyar’s Rule had applied. Bars are SEMs.

