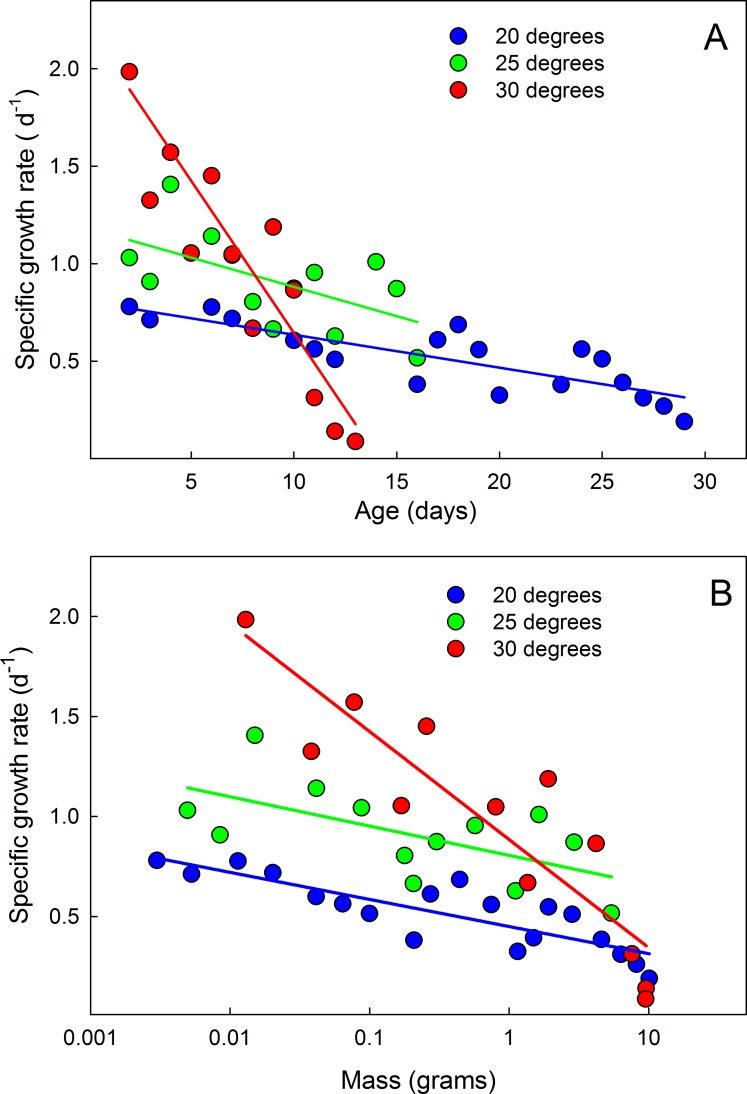
Fig 8. Mean mass-specific growth rates decline during larval life.
(A) Declining specific growth rate with time. (B) Declining specific growth rate with mass. Each point is the mean value on successive days of 14 larvae at 20°C, and 15 larvae at 25 and 30°C. Larvae that were molting (and thus not growing) on a given day were omitted from the calculations.

