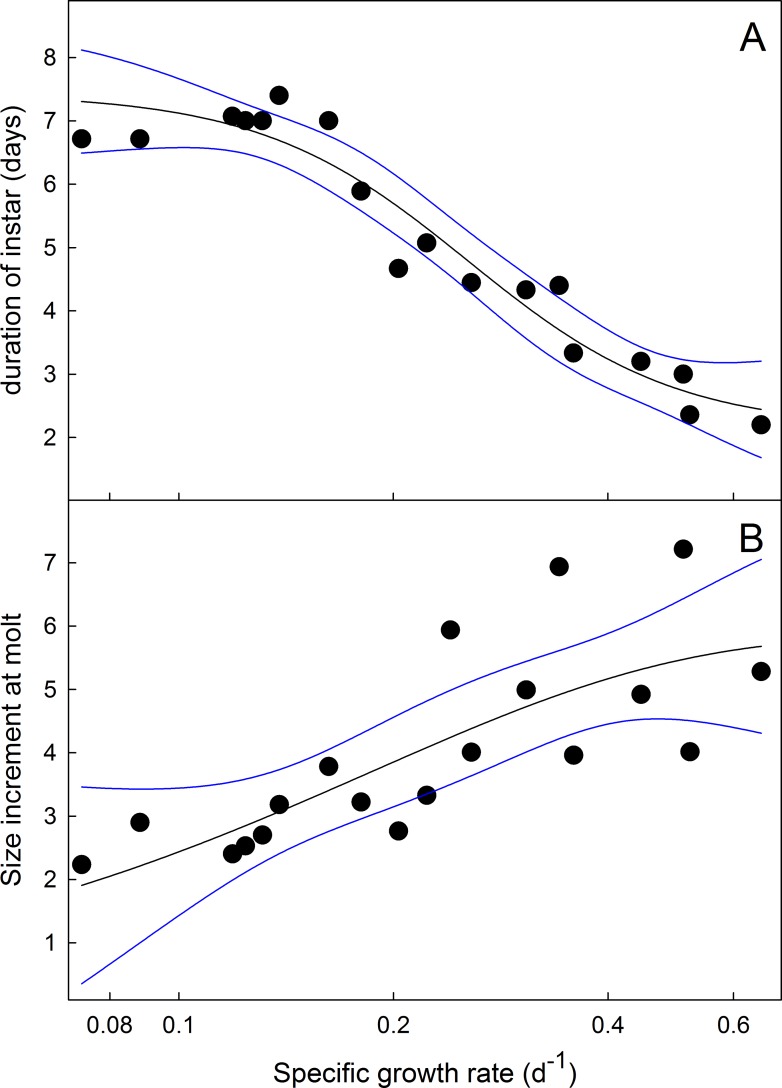
Fig 9. Dependence of duration of instar and size increments at molting on the growth rate.
(A) Mean mass-specific growth rate versus duration of instar at 25°C taken from larvae growing on both normal and nutrient-deficient diets. (B) Mean mass specific growth rate versus size increment at each molt. Black lines are fits by non-linear (sigmoidal) regression. Outer bands are 95% confidence intervals.

