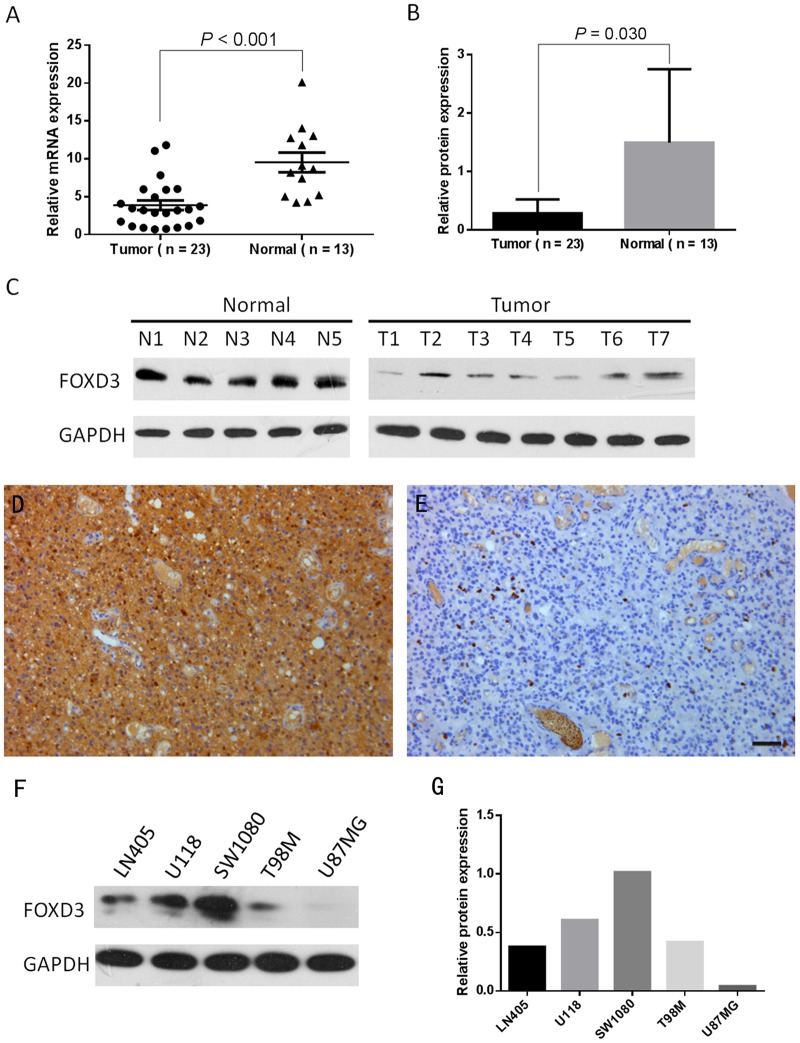
Fig 1. FOXD3 expression in HGG tissues and glioma cell lines.
A: FOXD3 mRNA expression in 23 HGG cases and 13 control tissues. B: FOXD3 protein expression in 23 HGG cases and 13 control tissues. C: Representative protein expression of FOXD3 in 7 HGG cases and 5 control tissues by western blotting. D and E: Representative immunohistochemical staining of high expression and low FOXD3 expression in HGG cases, respectively. F and G: FOXD3 expression in five glioma cell lines by western blotting. Scale bar, 50μm.

