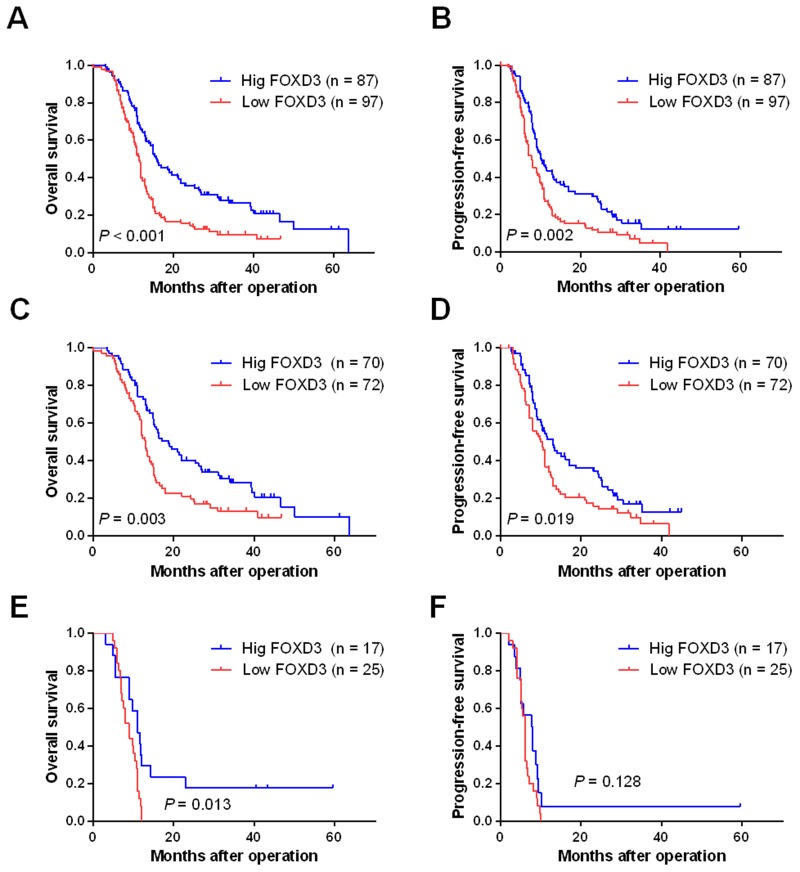
Fig 2. Low FOXD3 expression was assotiated with poor prognosis in HGG patients.
A and B: Kaplan-Meier curves OS and PFS in all HGG patients according to the expression levels of FOXD3, respectively. C and D: Kaplan-Meier curves OS and PFS in grade III glioma patients according to the expression levels of FOXD3, respectively. E and F: Kaplan-Meier curves OS and PFS in grade IV glioma patients according to the expression levels of FOXD3, respectively.

