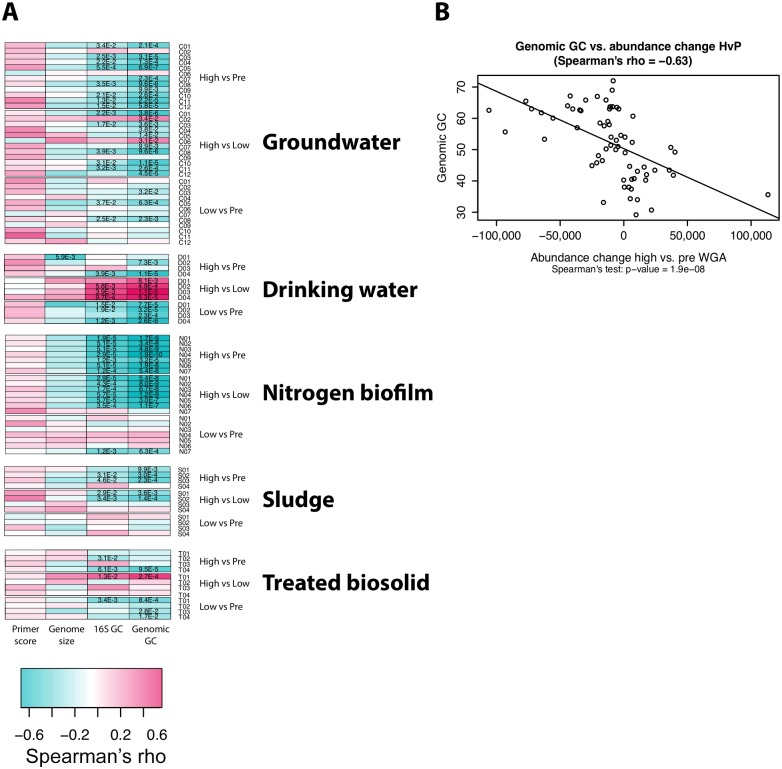
Fig 3. Correlation analysis between OTU abundance shift and genomic properties on family level.
A: Heatmap of correlation coefficients (Spearman’s rho) between the OTU abundance shift and the mean per family of four genomic properties. Each row contains the correlation coefficients for OTU abundance shifts between two WGA treatments (high vs. pre, high vs. low or low vs. pre) for one sample. Each column shows the correlation coefficients for one genomic property (Primer score, Genome size, 16S GC and Genomic GC). Dark turquoise color indicates a negative correlation, dark red color a positive correlation. Significant p-values are given as numbers in each cell after applying Benjamini-Hochberg correction. B: As an example of the correlation of genomic GC and abundance changes, significantly different families for sample type N (pre vs. hi, Fig 2 and S2 Fig) were used. The plot shows a significant negative correlation, as do all other analyses of the samples for significantly different families.

