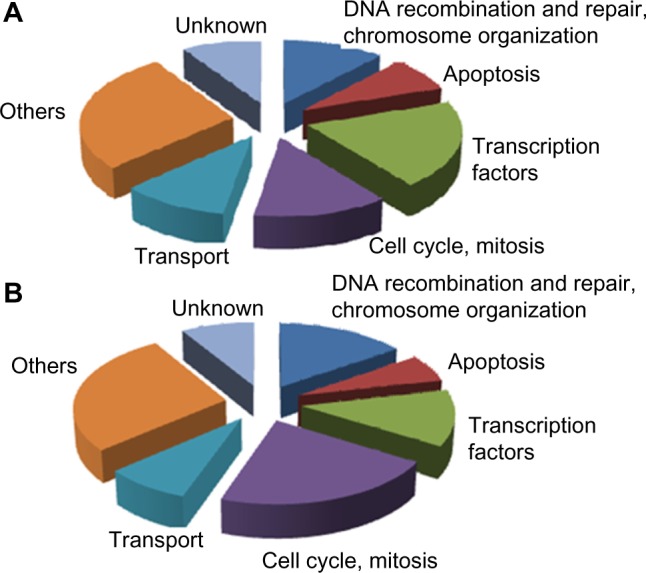
Figure 1.

Pie charts showing distribution of the biological processes in which the identified significantly differentially expressed genes are involved as assessed by GO analysis. (A) A set of genes that are upregulated in patients with positive MRD at day 46. (B) Genes downregulated in patients with positive MRD at day 46.
