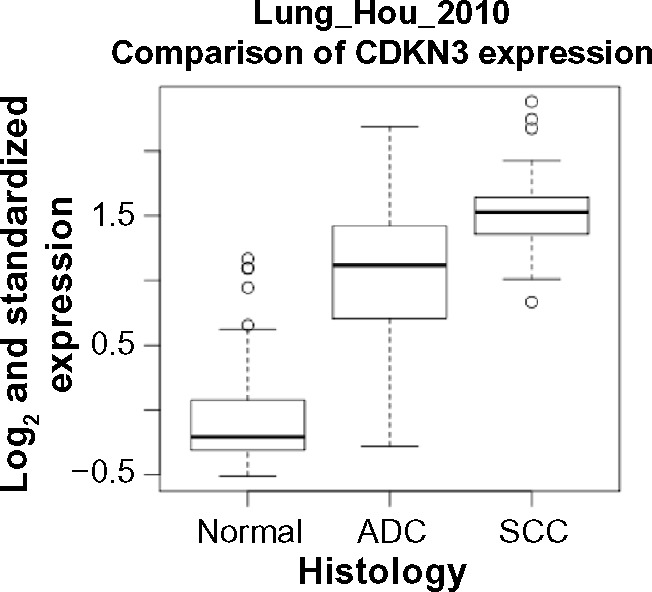
Figure 1.

Box plots of CDKN3 expression levels in normal tissues, ADC samples and SCC samples. Comparison among the three groups was made by the commonly used parametric method, one-way ANOVA with Tukey test, as well as a nonparametric method, Kruskal-Wallis test (with pairwise Wilcoxon-Mann-Whitney test). P-values of the pairwise comparisons are less than 0.0001 by both methods. n = 65 for normal, n = 45 for ADC and n = 27 for SCC.
