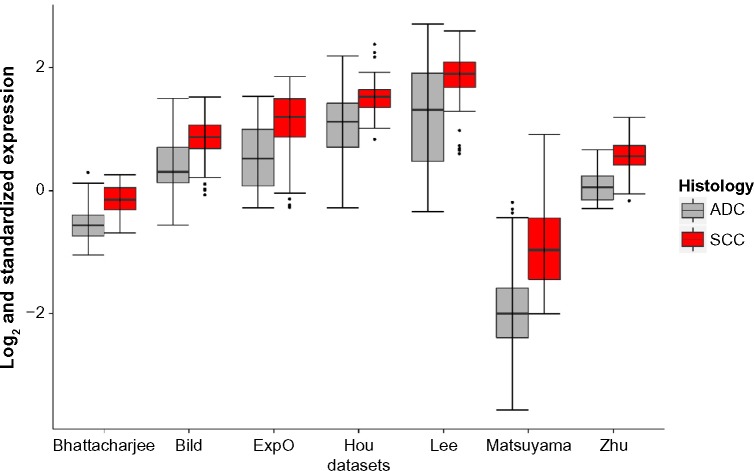
Figure 2C.
Box plots of CDKN3 expression levels in ADC samples and SCC samples. Comparison between the two groups was made by two-sample t-test (a parametric method) and Wilcoxon-Mann-Whitney test (a nonparametric method) in datasets with adequate number of samples. The P-values are less than 0.0001 by both methods for all the seven datasets.

