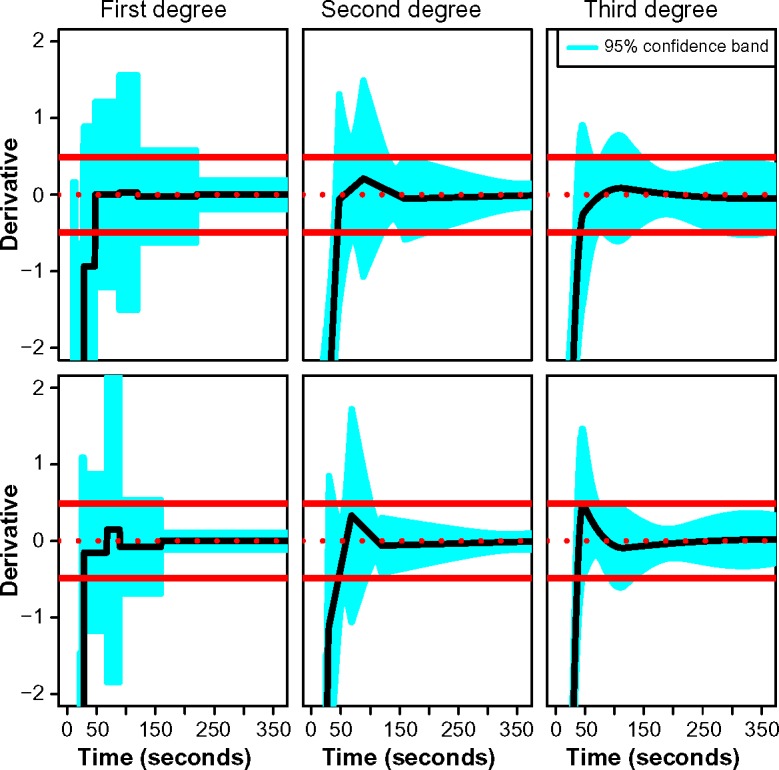
Figure 3.

Estimated best linear unbiased predictors of the derivatives as functions of acquisition time in tumor (top) and normal liver (bottom) using penalized spline regression with truncated polynomial bases of specified degree. Point estimates are represented by solid black lines. Shaded regions characterize 95% simultaneous confidence bands over the entire acquisition duration. Red lines are used to depict an equivalence region defined by the neighborhood contained within ±0.5.
