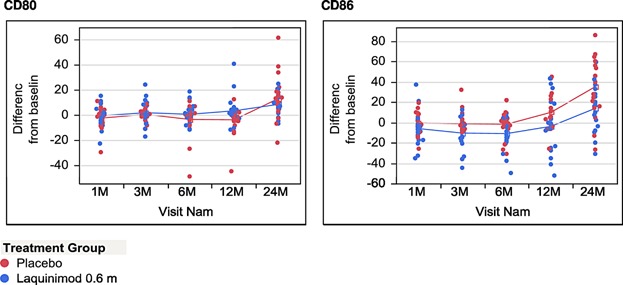
Figure 5.

Expression of CD80 or CD86 on monocytes in culture after stimulation with LPS. The graphs present the percentage on CD80 or CD86 positive monocytes stimulated for 48 h with LPS in culture. Due to the high intra-group variability of monocyte phenotype, in order to assess the time related changes in monocyte surface expression of co-stimulatory molecule in laquinimod and placebo treated patients, the results were expressed as ± percentage change from baseline value for each individual patient.
