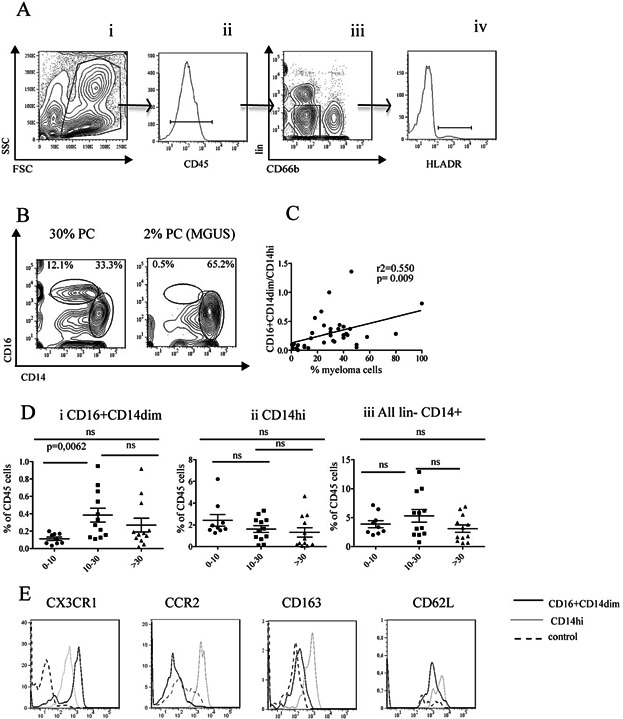
Figure 1.

CD16+CD14dim monocytes increase in the bone marrow of myeloma patients. (A) Gating strategy: Cells were stained with a cocktail of antibodies against CD66b, lineage (CD3, CD19, CD56, CD138, CD15, CD34, and CD235a), CD45, HLADR, CD16, and CD14 and analyzed on an LSR II Flow cytometer. Gates were set on FSC and SSC (i), doublets were excluded, and gates were set on the CD45+cells (ii). Lineage and CD66b+ were further excluded (iii). HLA DR+ cells are shown in (iv), and CD14 and CD16 profiles as shown in (B) were analyzed on these cells. (B) Representative CD14 and CD16 profiles from bone marrow aspirate from two patients with 30 and 2% PC, respectively. The gates indicated show the populations of % CD16+CD14dim and CD14high cells, respectively. (C) Correlation between the ratio of CD16+CD14dim cells/CD14high cells and percent PC in the bone marrow of patients (n = 33). Each dot represents a value from a patient as estimated by the gating indicated in Figure 1B. The P-value was calculated from Spearman's test. (D) CD16+CD14dim monocytes increase in the bone marrow of patients with intermediate levels of 10–30% plasma cells. Bone marrow monocytes were stained and analyzed as described above and in Methods. Figures show monocyte populations as percent of CD45+ cells. Patients were grouped as low percent PC (0–10%) (n = 9), intermediate (10–30%) (n = 12), and high (>30%) (n = 12). Each dot represents a patient. Monocyte populations: (i) CD16+CD14dim, (ii) CD14high, and (iii) all monocyte populations (lineage−granulocyte− CD14+). Statistical analysis was performed with Mann–Whitney Test. (E) CD16+CD14dim cells express markers defining the CX3CR1 subpopulation of monocytes. Representative histograms of CX3CR1, CCR2, CD163, and CD62L expression on gated CD16+CD14dim and CD14high monocytes. Gates were set as described in (A). FMO (fluorescence minus one) is used as negative control.
