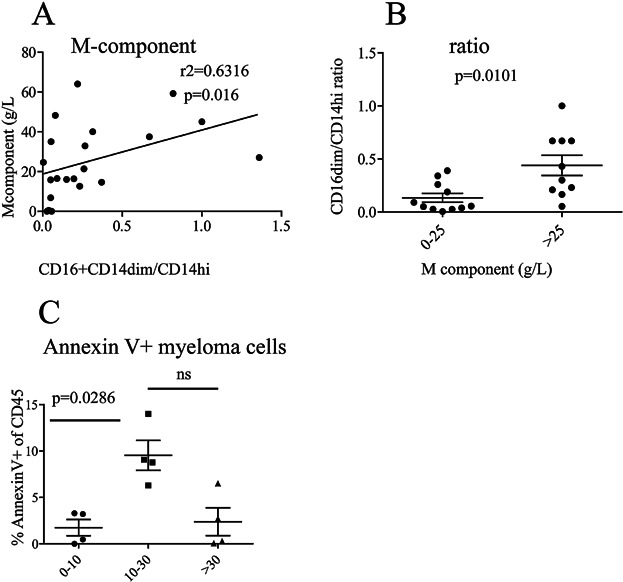
Figure 2.

The frequency of CD16+CD14dim monocytes increases with M-component and at high frequencies of apoptotic myeloma cells. (A) Increase in CD16+CD14dim monocytes correlates with concentration of M component in serum. This figure shows the concentration of M-component in the patients’ serum versus the ratio of CD16+CD14dim/CD14high cells. Each dot represents a patient (n = 22). P-value was calculated from a Spearman's test. (B) The proportions of CD16+CD14dim monocytes were significantly higher in patients with high levels of M-component. Patients were grouped into two groups, below median value of 25 g/L (0–25 g/L, n = 12) and above (>25 g/L, n = 10), serum M-component. Each dot represents one patient and P-value was calculated from Mann–Whitney Test. (C) Patients with intermediate levels of bone marrow PCs had more apoptotic PCs. Bone marrow aspirate cells were stained with a cocktail of anti CD138, CD38, CD19, CD3, CD45, Annexin V, and 7AAD. Gates were set on live cells; duplet and lineage (CD3, CD19) were excluded. Gates were then set on the CD138+ CD38+ myeloma cells and the frequency of Annexin V+ 7AAD+ double positive cells of the CD45+ (high and low) population is shown. Patients were grouped as low percentage of bone marrow PC (0–10%) (n = 4), intermediate (10–30%) (n = 4), and high (>30%) (n = 3). Each symbol represents one patient and P-value was calculated using Mann–Whitney Test.
