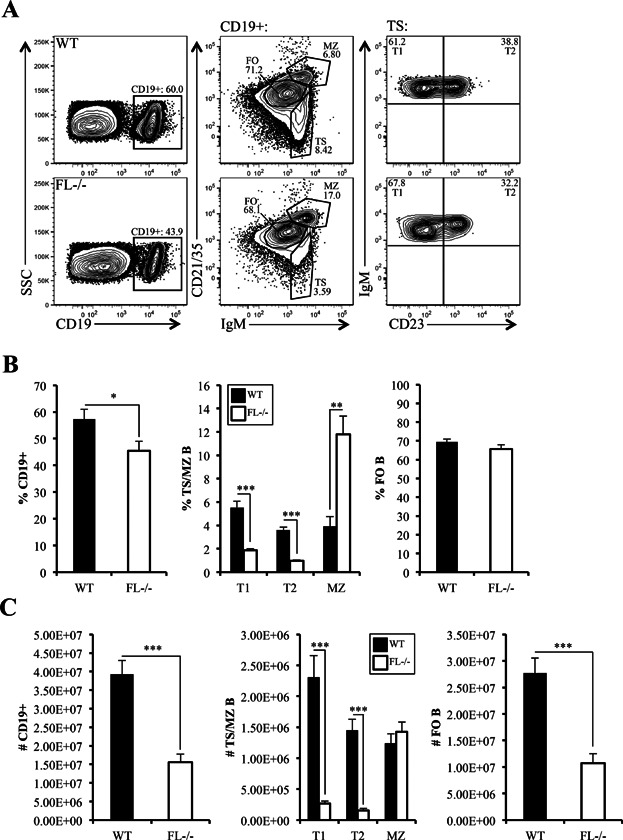
Figure 1.

Impaired peripheral B cell maturation in FL-/- mice. (A) Flow cytometric analysis of splenic CD19+ B cells from a representative wild-type (WT) and FL-/- mouse further stained by CD21/35, IgM, and CD23 to examine transitional (TS), marginal zone (MZ), and follicular (FO) B cell subsets. TS B cells are further stained using CD23 to characterize T1 and T2 B cells (right panels). (B and C) Bar graphs illustrating the frequency (B) and absolute numbers (C) of total CD19+ and T1, T2, MZ, and FO B cell subsets in the spleens of WT and FL-/- mice. The bars represent WT (black) or FL-/- (white). (B) Frequencies reflect the proportion these cells represent within the CD19+ fraction of spleen. (A–C) Data are representative of 15–16 mice/genotype and six independent experiments. Error bars represent mean ± SEM. *, **, and *** represent statistically significant differences measured using the Student's t-test at P ≤ 0.05, P ≤ 0.005, and P < 0.0001, respectively.
