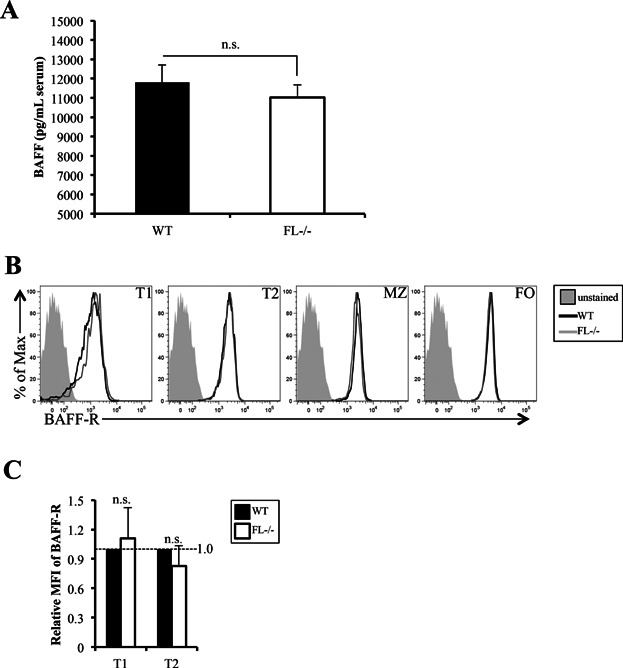
Figure 2.

Reductions in TS and FO B cell subsets in FL-/- mice are not due to defects in BAFF or BAFF-R. (A) Concentration of BAFF (pg/mL) in the serum of wild-type (WT) and FL-/- mice as determined by ELISA. Data is representative of seven mice/genotype. (B) Flow cytometric analysis of BAFF-R in T1, T2, MZ, and FO B cell subsets. The filled histogram represents the unstained control; the black line indicates BAFF-R staining in T1, T2, MZ, or FO subsets in WT mice, and the gray line for FL-/- mice. (C) Bar graph depicting the relative mean fluorescence intensity (MFI) of BAFF-R in WT (normalized to 1, further described in Materials and Methods) and FL-/- T1 and T2 B cells. The bars represent WT (black) or FL-/- (white). (B and C) Data are representative of nine mice/genotype and three independent experiments. (A and C) Error bars represent mean ± SEM. n.s. signifies non-statistical differences measured using the Student's t-test (P > 0.05) between the means of different genotypes.
