
Figure 6.
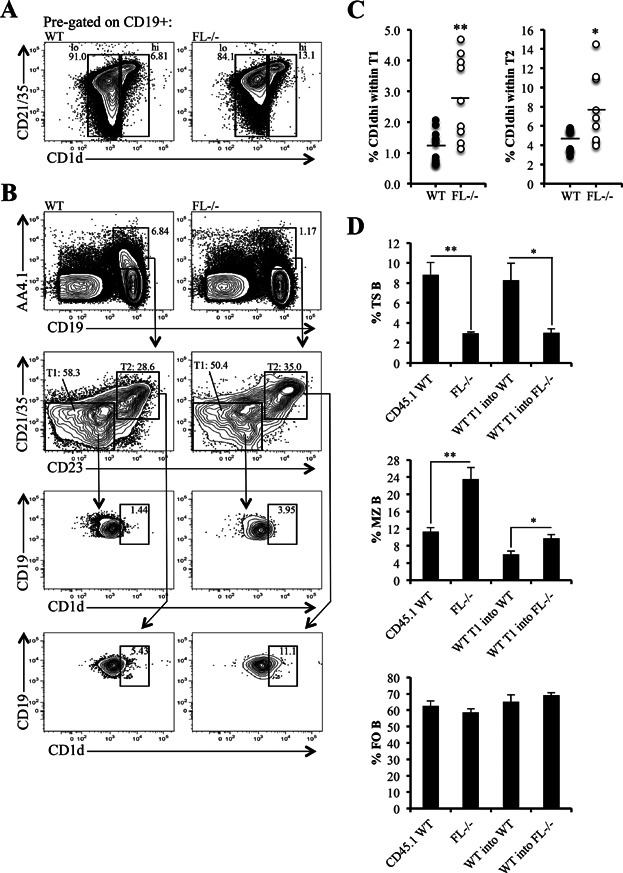
Evidence of marginal zone skewing within T1 and T2 subsets in FL-/- mice. (A) Flow cytometric analysis of splenic CD19+ B cells (pre-gated) from a representative wild-type (WT) and FL-/- mouse further stained by CD21/35 and CD1d to examine CD1dhi and CD1dlo peripheral B cell subsets. (B) Splenic cells were stained using CD19 and AA4.1 to initially resolve CD19+ AA4.1+ TS B cells. To examine T1 and T2 B cells, CD19+ AA4.1+ cells were further characterized using CD21/35 and CD23. T1 are defined as CD21/35-/lo CD23− and T2 are CD21/35lo/int CD23+ within CD19+ AA4.1+ TS B cells. T1 and T2 were subsequently analyzed with CD1d to determine the percentage of CD1dhi cells within these TS subsets. CD1dhi gates were set based on expression of CD1d in the MZ as in (A). (A and B) Data are representative of 9–11 mice/genotype and four independent experiments. (C) Scatter plots depict the frequency of CD1dhi cells within T1 and T2 B cells in each WT and FL-/- mouse in the analysis (n = 11 WT and 9 FL-/- mice). (D) Bar graphs illustrating percentages of TS, MZ, and FO B cells generated from WT CD45.1+ T1 B cells adoptively transferred into CD45.2 WT (WT T1 into WT) or CD45.2 FL-/- (WT T1 into FL-/-) mice. The bars labeled CD45.1 WT represent TS, MZ, and FO B cells from uninjected CD45.1 WT mice analyzed to ensure correct CD45.1+ and peripheral B cell subset gating. Bars labeled FL-/- PBS represent endogenous CD45.2+ TS, MZ, and FO B cells from PBS-injected CD45.2 FL-/- mice. CD45.1 background staining (controlled by PBS-injected CD45.2 FL-/- mice) was very minimal, averaging 0.0003 ± 0.0003% or 12 ± 11 CD45.1+ cells (data not shown). Data are representative of 5–9 mice/condition and five independent experiments. (C and D) * and ** represent statistically significant differences measured using the Student's t-test at P ≤ 0.05 and P ≤ 0.005, respectively.