
Figure 2.
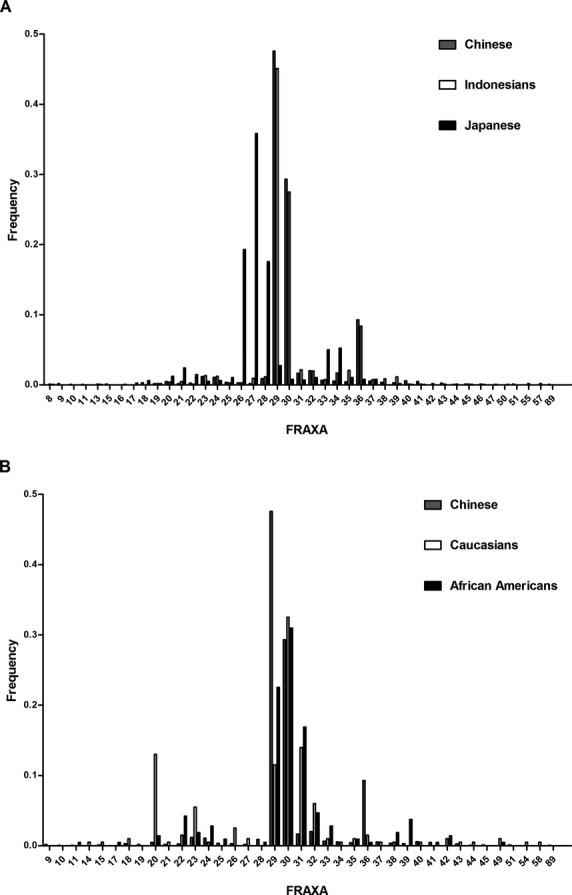
Frequency distribution of FMR1 CGG repeat length among the unaffected populations. (A) Chinese (n = 1692; gray bars), Indonesians (n = 1062; white bars) (Faradz et al. 2000), and Japanese (n = 1161; black bars) (Otsuka et al. 2010). (B) Chinese (n = 1692; gray bars), Caucasians (n = 200; white bars) (Crawford et al. 2000b), and African Americans (n = 213; black bars) (Eichler et al. 1996). FMR, fragile X mental retardation 1.