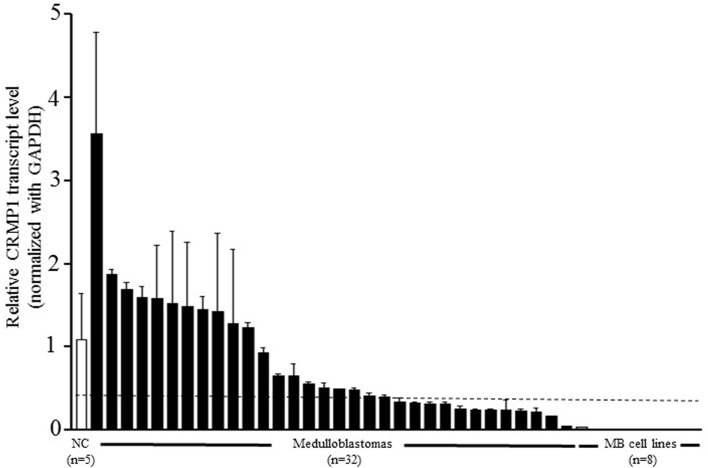
Fig 2. Reduced transcript level of CRMP1 in MB tumors and cell lines.
Expression of CRMP1 was measured by quantitative RT-PCR in 32 primary MBs (black bar), 8 cell lines (grey bar) and 5 normal cerebella (white bar). Compared to the mean of 5 normal cerebella, CRMP1 was significantly lower in 12/32 (37.5%) of MB and 8/8 (100%) of MB cell lines. The samples below the dot line were detected with reduced CRMP1 expression. The bar represents the mean of three measurements and the error bars indicates the standard deviation (SD).

