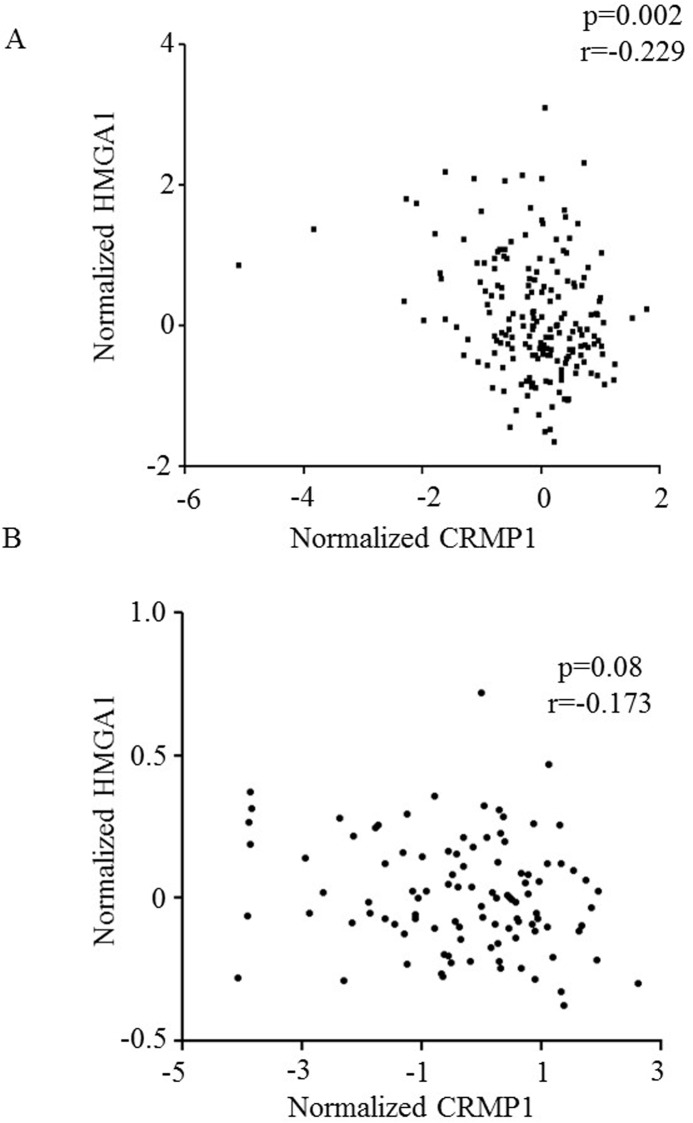
Fig 3. An inverse correlation between HMGA1 and CRMP1 expression as revealed by expression profiling studies.
Expression data were retrieval from (A) Cho et al. study which comprised of 189 MB and (B) Northcott et al. study which comprised of 103 MB. Correlation coefficients were determined with Pearson's correlation analysis.

