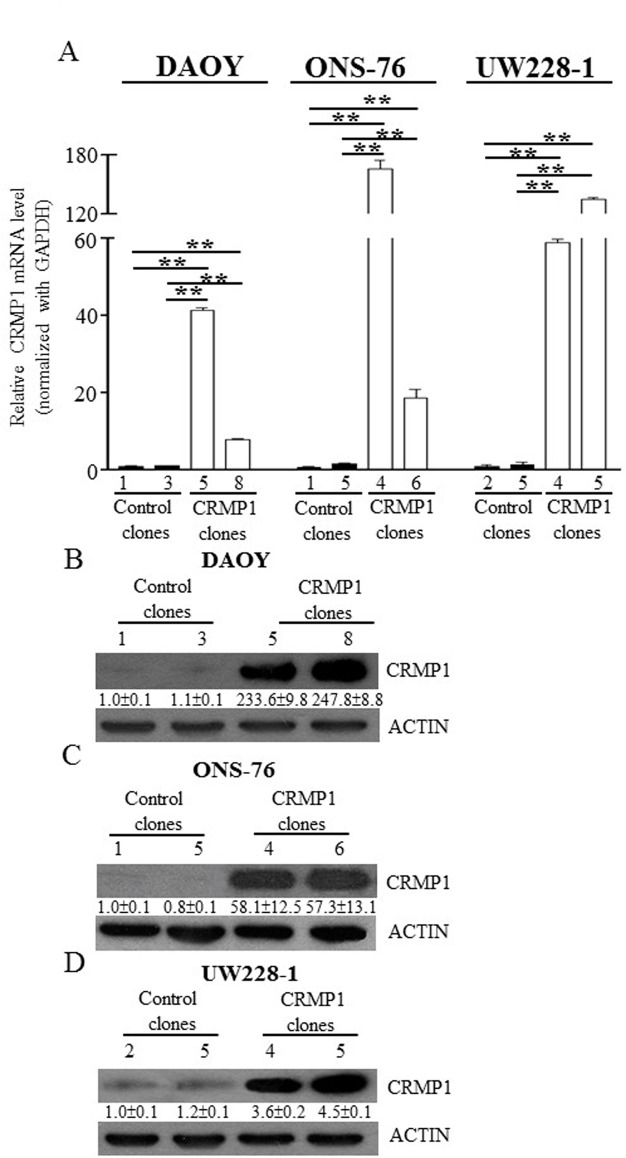
Fig 5. Generation of CRMP1 stably expressed MB cells.
DAOY, ONS-76, and UW228-1 cells were transfected with pcDNA3.1-CRMP1 or pcDNA3.1 control plasmids. Stable clones were isolated by selection with G418. (A) Quantitative RT-PCR of CRMP1 in CRMP1 stably expressed cells and control cells. CRMP1 expression was normalized with GAPDH. The columns are expressed as mean±SD (** indicates p<0.01). (B) Western blot analysis of CRMP1 in clones of DAOY (top), ONS-76 (middle), and UW228-1 (bottom). The numbers under the protein bands indicated the relative band intensity normalized with ACTIN, and the control clones were set to 1. ImageJ software was used for quantification.

