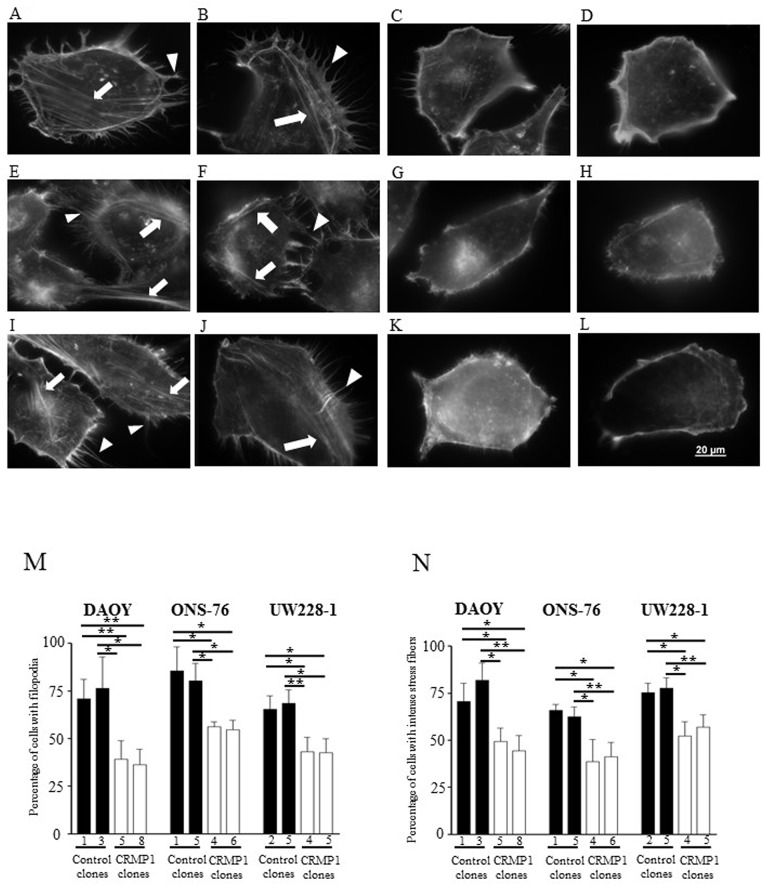
Fig 9. Overexpression of CRMP1 suppressed filopodia and intense stress fibers formation.
F-actin organization was visualized using TRITC-conjugated phalloidin. Representative images of actin cytoskeleton structures in (A) DAOY-control-#1, (B) DAOY-control-#3, (C) DAOY-CRMP1-#5, (D) DAOY-CRMP1-#8, (E) ONS-76-control#1, (F) ONS-76-control#5, (G) ONS-76-CRMP1#4, (H) ONS-76-CRMP1#6, (I) UW228-1-control-#2, (J) UW228-1-control-#5, (K) UW228-1-CRMP1-#4, and (L) UW228-1-CRMP1-#6. Arrowheads represent filopodia and arrows indicate intense stress fibers. (M) The percentage of cells with filopodial protrusions was decreased in MB clones stably expressing CRMP1. A minimum of 100 individual cells of each clone were counted, and cells showing more than 20 filopodia were considered positive. (N) A minimum of 100 individual cells of each clone were counted to determine the percentage of cells bearing stress fibers in cell body. Data show the mean±SD from three individual experiments.

