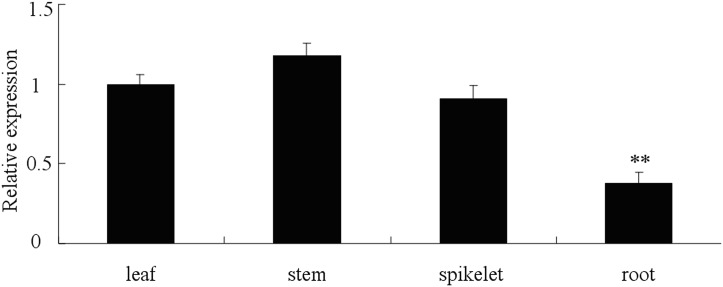
Fig 3. Expression profiles of the TaLHY gene in different wheat tissues.
The relative expression of TaLHY was normalized to the transcript abundances in leaves (as 1). The error bars represent the standard deviation among three biological replicates. The asterisks indicate statistically significant variation calculated using Student’s t-test. (*P<0.05; ** P<0.01).

