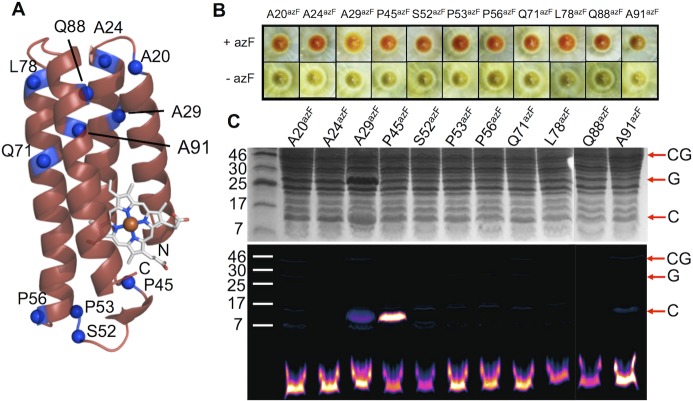
Fig 4. Production and conjugation of cyt b 562 azF-containing variants.
(A) Schematic structure of cyt b 562 showing the residues substituted with azF. (B) Expression of cyt b 562 variants housed in the pIFtag plasmid in the presence (+azF) or absence (-azF) of azF. Cells successfully expressing functional cyt b 562 display a red phenotype. (C) SDS-PAGE analysis of SPAAC conjugation. The top panel shows the Coomassie Blue stained and the bottom is fluorescence imaging of the DBCO-585 moiety. CG, G and C refer to cyt b 562-sfGFP fusion, sfGFP and cyt b 562, respectively. The lower band is unreacted DBCO-585. For the sake of transparency, the samples Q88 and A91 were run on separate gels to the others and the resulting images electronically linked to the other samples.

