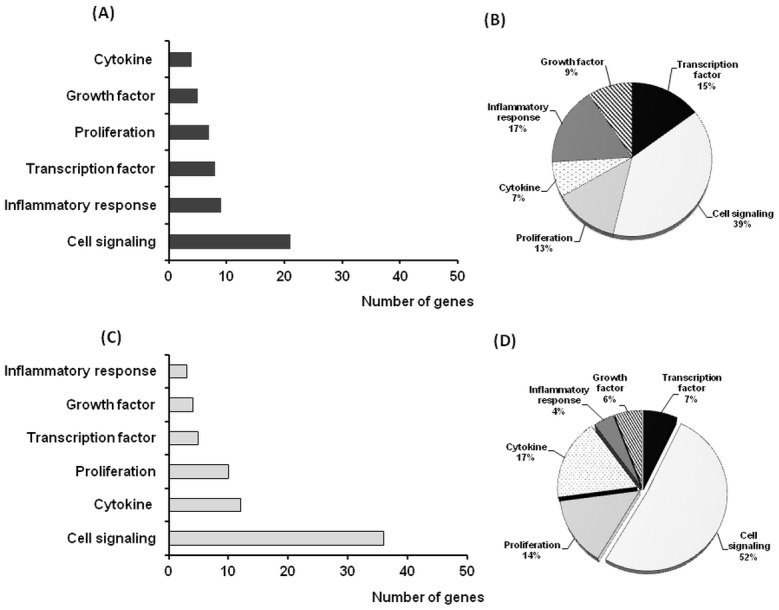
Fig 2. Functional cluster analyses.

Differentially regulated gene profile in spleen. Spleen up- and down-regulated genes of the 6 functional groups based on gene ontology available in the Entrez data base. (A) Number of up-regulated genes. (B) % of up-regulated genes. (C) Number of down-regulated genes. (D) % of down-regulated genes.
